pygmt.Figure.show
- Figure.show(dpi=300, width=500, method=None, waiting=0.5, **kwargs)[source]
Display a preview of the figure.
Inserts the preview in the Jupyter notebook output if available, otherwise opens it in the default viewer for your operating system (falls back to the default web browser).
pygmt.set_displaycan select the default display method ("notebook","external","none"orNone).The
methodparameter can also override the default display method for the current figure. Parametersdpiandwidthcan be used to control the resolution and dimension of the figure in the notebook.Note: The external viewer can be disabled by setting the PYGMT_USE_EXTERNAL_DISPLAY environment variable to false. This is useful when running unit tests and building the documentation in consoles without a Graphical User Interface.
Note that the external viewer does not block the current process, thus it’s necessary to suspend the execution of the current process for a short while after launching the external viewer, so that the preview image won’t be deleted before the external viewer tries to open it. Set the
waitingparameter to a larger number if your computer is slow.- Parameters
dpi (int) – The image resolution (dots per inch) in Jupyter notebooks.
width (int) – The image width (in pixels) in Jupyter notebooks.
method (str or None) –
How the current figure will be displayed. Choose from:
"external": External PDF preview using the default PDF viewer"notebook": Inline PNG preview in the current notebook"none": Disable image previewNone: Reset to the default display method
The default display method is
"external"in Python consoles or"notebook"in Jupyter notebooks, but can be changed bypygmt.set_display.waiting (float) – Suspend the execution of the current process for a given number of seconds after launching an external viewer. Only works if
method="external".**kwargs (dict) – Additional keyword arguments passed to
pygmt.Figure.psconvert. Valid parameters aregs_path,gs_option,resize,bb_style, andverbose.
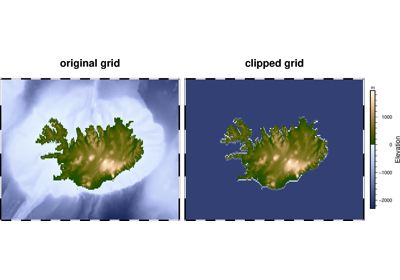
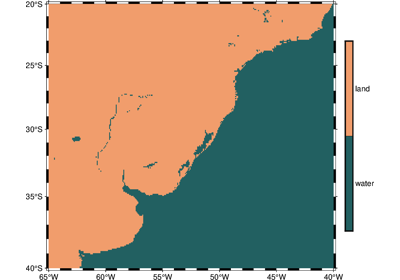
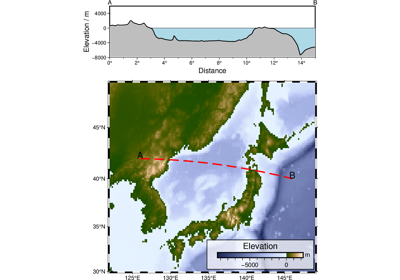
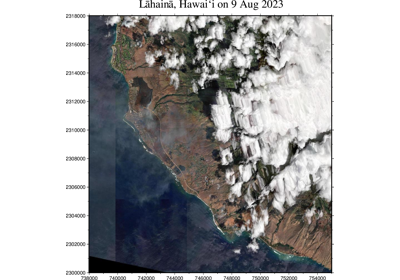
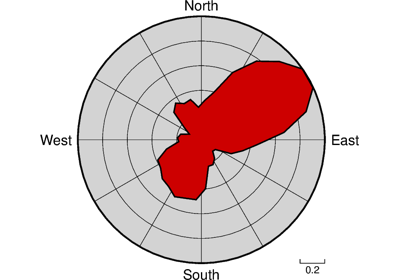
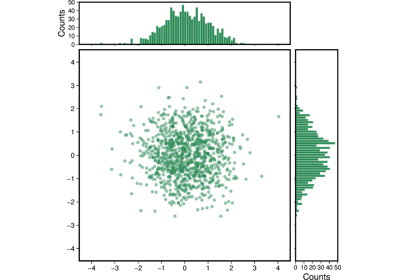
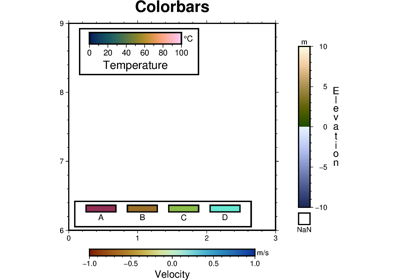
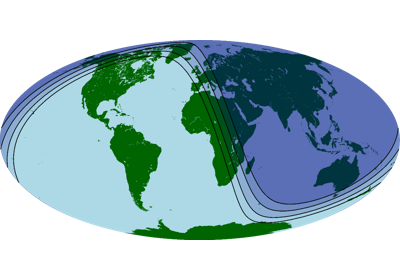
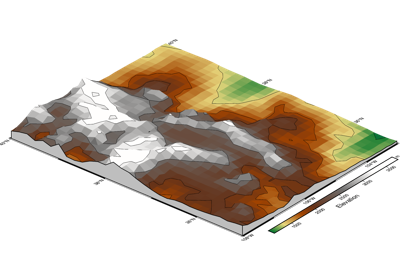
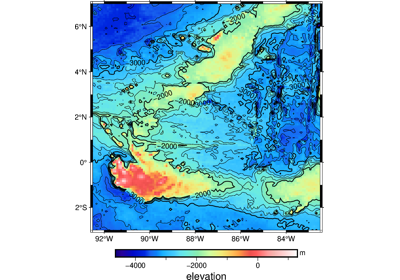
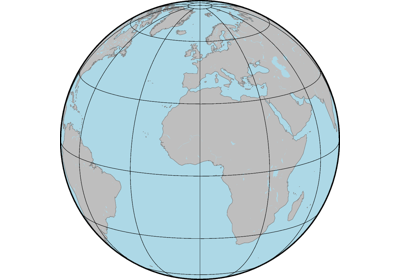
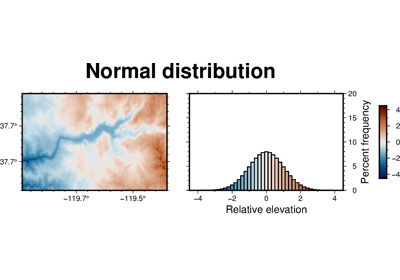
Examples using pygmt.Figure.show


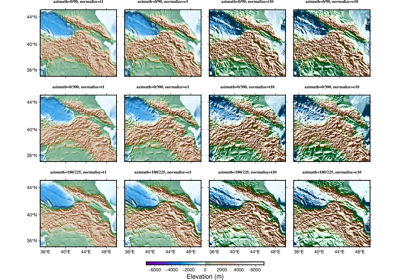
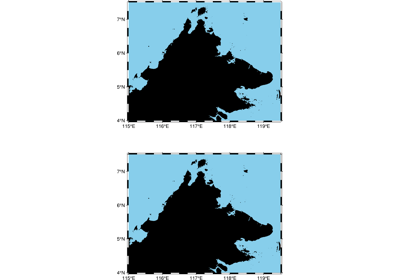
Calculating grid gradient with custom azimuth and normalize parameters