Note
Go to the end to download the full example code
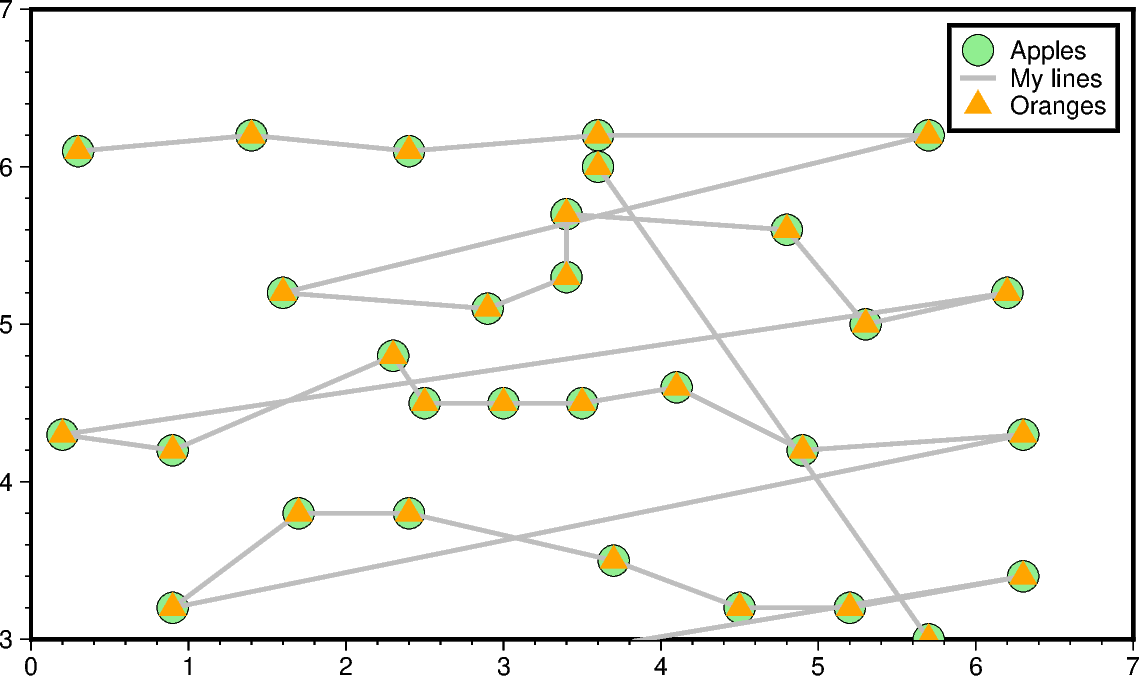
Legend
The pygmt.Figure.legend method can automatically create a legend for
symbols plotted using pygmt.Figure.plot. Legend entries are only
created when the label parameter is used. For more complicated legends,
including legends with multiple columns, users have to write an ASCII file
with instructions for the layout of the legend items and pass it
to the spec parameter of pygmt.Figure.legend. For details on
how to set up such a file, please see the GMT documentation at
https://docs.generic-mapping-tools.org/latest/legend.html#legend-codes.
import pygmt

fig = pygmt.Figure()

fig.basemap(projection="x2c", region=[0, 7, 3, 7], frame=True)

fig.plot(
    data="@Table_5_11.txt",
    style="c0.40c",
    fill="lightgreen",
    pen="faint",
    label="Apples",
)
fig.plot(data="@Table_5_11.txt", pen="1.5p,gray", label="My lines")
fig.plot(data="@Table_5_11.txt", style="t0.40c", fill="orange", label="Oranges")

fig.legend(position="JTR+jTR+o0.2c", box=True)

fig.show()
Total running time of the script: ( 0 minutes 0.878 seconds)