pygmt.Figure.basemap
- Figure.basemap(*, region=None, projection=None, zscale=None, zsize=None, frame=None, map_scale=None, box=None, rose=None, compass=None, verbose=None, panel=None, coltypes=None, perspective=None, transparency=None, **kwargs)
Plot base maps and frames for the figure.
Creates a basic or fancy basemap with axes, fill, and titles. Several map projections are available, and the user may specify separate tick-mark intervals for boundary annotation, ticking, and [optionally] gridlines. A simple map scale or directional rose may also be plotted.
At least one of the parameters
frame,map_scale,rose, orcompassmust be specified if not in subplot mode.Full option list at https://docs.generic-mapping-tools.org/6.5/basemap.html
Aliases:
B = frame
F = box
J = projection
JZ = zsize
Jz = zscale
L = map_scale
R = region
Td = rose
Tm = compass
V = verbose
c = panel
f = coltypes
p = perspective
t = transparency
- Parameters:
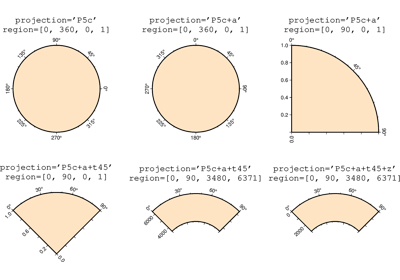
projection (str) – projcode[projparams/]width|scale. Select map projection.
zscale/zsize (float or str) – Set z-axis scaling or z-axis size.
region (str or list) – xmin/xmax/ymin/ymax[+r][+uunit]. Specify the region of interest. Required if this is the first plot command.
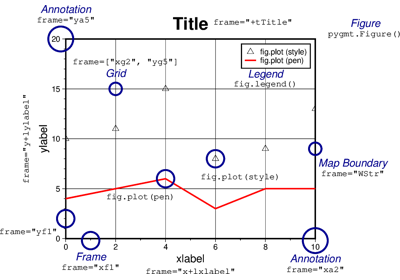
frame (bool, str, or list) – Set map boundary frame and axes attributes.
map_scale (str) – [g|j|J|n|x]refpoint+wlength. Draw a simple map scale centered on the reference point specified.
box (bool or str) – [+cclearances][+gfill][+i[[gap/]pen]][+p[pen]][+r[radius]][+s[[dx/dy/][shade]]]. If set to
True, draw a rectangular border around the map scale or rose. Alternatively, specify a different pen with +ppen. Add +gfill to fill the scale panel [Default is no fill]. Append +cclearance where clearance is either gap, xgap/ygap, or lgap/rgap/bgap/tgap where these items are uniform, separate in x- and y-direction, or individual side spacings between scale and border. Append +i to draw a secondary, inner border as well. We use a uniform gap between borders of 2p and the MAP_DEFAULTS_PEN unless other values are specified. Append +r to draw rounded rectangular borders instead, with a 6p corner radius. You can override this radius by appending another value. Finally, append +s to draw an offset background shaded region. Here, dx/dy indicates the shift relative to the foreground frame [Default is"4p/-4p"] and shade sets the fill style to use for shading [Default is"gray50"].rose (str) – Draw a map directional rose on the map at the location defined by the reference and anchor points.
compass (str) – Draw a map magnetic rose on the map at the location defined by the reference and anchor points.
Select verbosity level [Default is w], which modulates the messages written to stderr. Choose among 7 levels of verbosity:
q - Quiet, not even fatal error messages are produced
e - Error messages only
w - Warnings [Default]
t - Timings (report runtimes for time-intensive algorithms)
i - Informational messages (same as
verbose=True)c - Compatibility warnings
d - Debugging messages
panel (bool, int, or list) – [row,col|index]. Select a specific subplot panel. Only allowed when in subplot mode. Use
panel=Trueto advance to the next panel in the selected order. Instead of row,col you may also give a scalar value index which depends on the order you set viaautolabelwhen the subplot was defined. Note: row, col, and index all start at 0.coltypes (str) – [i|o]colinfo. Specify data types of input and/or output columns (time or geographical data). Full documentation is at https://docs.generic-mapping-tools.org/6.5/gmt.html#f-full.
perspective (list or str) – [x|y|z]azim[/elev[/zlevel]][+wlon0/lat0[/z0]][+vx0/y0]. Select perspective view and set the azimuth and elevation angle of the viewpoint [Default is
[180, 90]]. Full documentation is at https://docs.generic-mapping-tools.org/6.5/gmt.html#perspective-full.transparency (float) – Set transparency level, in [0-100] percent range [Default is
0, i.e., opaque]. Only visible when PDF or raster format output is selected. Only the PNG format selection adds a transparency layer in the image (for further processing).