pygmt.Figure.scalebar
- Figure.scalebar(length, height=None, position=None, scale_loc=False, label=False, label_alignment=None, unit=False, fancy=False, vertical=False, box=False, verbose=False, panel=False, perspective=False, transparency=None)
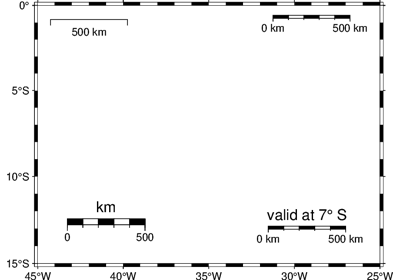
Add a scale bar on the plot.
- Parameters:
length (
float|str) – Length of the scale bar in kilometers. Append a suffix to specify another unit. Valid units are: e: meters; f: feet; k: kilometers; M: statute miles; n: nautical miles; u: US survey feet.height (
float|str|None, default:None) – Height of the scale bar [Default is"5p"]. Only works whenfancy=True.position (
Position|Sequence[float|str] |Literal['TL','TC','TR','ML','MC','MR','BL','BC','BR'] |None, default:None) –Position of the scale bar on the plot. It can be specified in multiple ways:
A
pygmt.params.Positionobject to fully control the reference point, anchor point, and offset.A sequence of two values representing the x- and y-coordinates in plot coordinates, e.g.,
(1, 2)or("1c", "2c").A 2-character justification code for a position inside the plot, e.g.,
"TL"for Top Left corner inside the plot.
If not specified, defaults to the Bottom Left corner of the plot with a 0.2-cm and 0.4-cm offset in the x- and y-directions, respectively.
scale_loc (
float|Sequence[float] |bool, default:False) –Specify the location where the map scale is calculated. It can be:
slat: Map scale is calculated for latitude slat.
(slon, slat): Map scale is calculated for latitude slat and longitude slon, which is useful for oblique projections.
True: Map scale is calculated for the middle of the map.False: Default to the location of the reference point.
label (
str|bool, default:False) – Text string for the scale bar label. IfFalse, no label is added. IfTrue, the distance unit provided in thelengthparameter is used [Default is"km"]. Requiresfancy=True.label_alignment (
Literal['left','right','top','bottom'] |None, default:None) – Alignment of the scale bar label. Choose from"left","right","top", or"bottom"[Default is"top"].fancy (
bool, default:False) – IfTrue, draw a “fancy” scale bar, which is a segmented bar with alternating black and white rectangles. IfFalse, draw a plain scale bar. Only supported for non-Cartesian projections.unit (
bool, default:False) – IfTrue, append the unit to all distance annotations along the scale. For a plain scale, this will instead select the unit to be appended to the distance length. The unit is determined from the suffix provided to thelengthparameter or defaults to"km".vertical (
bool, default:False) – IfTrue, plot a vertical rather than a horizontal scale. Only supported for Cartesian projections.box (
Box|bool, default:False) – Draw a background box behind the scale bar. If set toTrue, a simple rectangular box is drawn using MAP_FRAME_PEN. To customize the box appearance, pass apygmt.params.Boxobject to control style, fill, pen, and other box properties.verbose (bool or str) – Select verbosity level [Full usage].
panel (
int|Sequence[int] |bool, default:False) –Select a specific subplot panel. Only allowed when used in
Figure.subplotmode.Trueto advance to the next panel in the selected order.index to specify the index of the desired panel.
(row, col) to specify the row and column of the desired panel.
The panel order is determined by the
Figure.subplotmethod. row, col and index all start at 0.perspective (
float|Sequence[float] |str|bool, default:False) –Select perspective view and set the azimuth and elevation of the viewpoint.
Accepts a single value or a sequence of two or three values: azimuth, (azimuth, elevation), or (azimuth, elevation, zlevel).
azimuth: Azimuth angle of the viewpoint in degrees [Default is 180, i.e., looking from south to north].
elevation: Elevation angle of the viewpoint above the horizon [Default is 90, i.e., looking straight down at nadir].
zlevel: Z-level at which 2-D elements (e.g., the plot frame) are drawn. Only applied when used together with
zsizeorzscale. [Default is at the bottom of the z-axis].
Alternatively, set
perspective=Trueto reuse the perspective setting from the previous plotting method, or pass a string following the full GMT syntax for finer control (e.g., adding+wor+vmodifiers to select an axis location other than the plot origin). See https://docs.generic-mapping-tools.org/6.6/gmt.html#perspective-full for details.transparency (float) – Set transparency level, in [0-100] percent range [Default is
0, i.e., opaque]. Only visible when PDF or raster format output is selected. Only the PNG format selection adds a transparency layer in the image (for further processing).
Examples
>>> import pygmt
>>> from pygmt.params import Position
>>> fig = pygmt.Figure()
>>> fig.basemap(region=[0, 80, -30, 30], projection="M10c", frame=True)
>>> fig.scalebar(
...     length=1000,
...     position=Position((10, 10), cstype="mapcoords"),
...     fancy=True,
...     label="Scale",
...     unit=True,
... )
>>> fig.show()