Note
Go to the end to download the full example code.
Scale bar
The map_scale parameter of the pygmt.Figure.basemap and
pygmt.Figure.coast methods is used to add a scale bar to a map.
This example shows how such a scale bar can be customized:
position: g|j|J|n|x. Set the position of the reference point. Choose from
g: Give map coordinates as longitude/latitude.
j|J: Specify a two-character (order independent) code. Choose from vertical T(op), M(iddle), or B(ottom) and horizontal L(eft), C(entre), or R(ight). Lower / uppercase j / J mean inside / outside of the map bounding box.
n: Give normalized bounding box coordinates as nx/ny.
x: Give plot coordinates as x/y.
length: +w. Give a distance value, and, optionally a distance unit. Choose from e (meters), f (feet), k (kilometers) [Default], M (statute miles), n (nautical miles), or u (US survey feet).
origin: +c[slon/]slat. Control where on the map the scale bar applies. If +c is not given the reference point is used. If only +c is appended the middle of the map is used. Note that slon is only optional for projections with constant scale along parallels, e.g., Mercator projection.
justify: +j. Set the anchor point. Specify a two-character (order independent) code. Choose from vertical T(op), M(iddle), or B(ottom) and horizontal L(eft), C(entre), or R(ight).
offset: +ooffset or +oxoffset/yoffset. Give either a common shift or individual shifts in x (longitude) and y (latitude) directions.
height: Use MAP_SCALE_HEIGHT via
pygmt.config.fancy style: +f. Get a scale bar that looks like train tracks.
unit: +u. Add the distance unit given via +w to the single distance values.
label: +l. Add the distance unit given via +w as label. Append text to get a customized label instead.
alignment: +a. Set the label alignment. Choose from t(op) [Default], b(ottom), l(eft), or r(ight).
import pygmt

# Create a new Figure instance
fig = pygmt.Figure()

# Mercator projection with 10 centimeters width
fig.basemap(region=[-45, -25, -15, 0], projection="M0/0/10c", frame=["WSne", "af"])

# -----------------------------------------------------------------------------
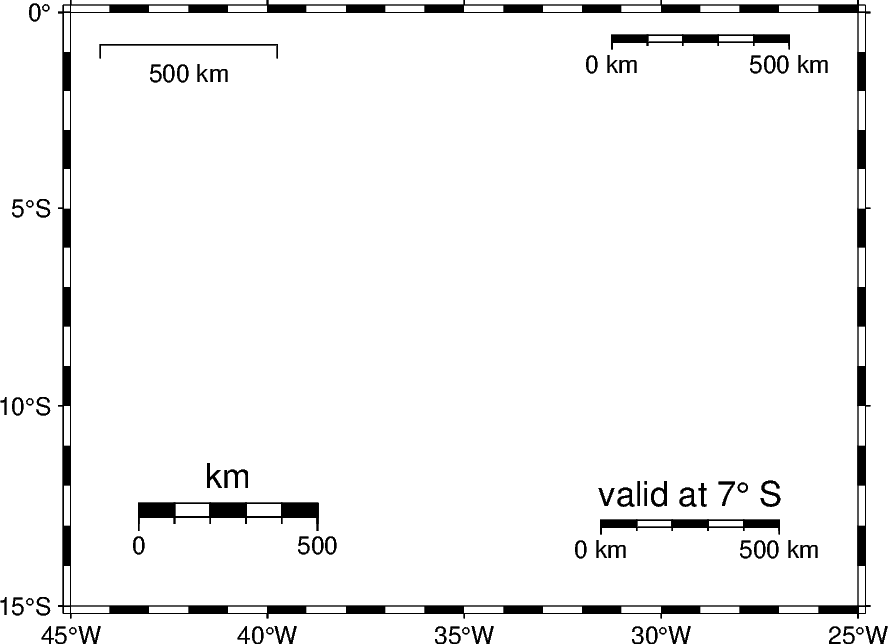
# Top Left: Add a plain scale bar
# It is placed based on geographic coordinates (g) 42° West and 1° South,
# applies at the reference point (+c is not given), and represents a
# length (+w) of 500 kilometers
fig.basemap(map_scale="g-42/-1+w500k")

# -----------------------------------------------------------------------------
# Top Right: Add a fancy scale bar
# It is placed based on normalized bounding box coordinates (n)
# Use a fancy style (+f) to get a scale bar that looks like train tracks
# Add the distance unit (+u) to the single distance values
fig.basemap(map_scale="n0.8/0.95+w500k+f+u")

# -----------------------------------------------------------------------------
# Bottom Left: Add a thick scale bar
# Adjust the GMT default parameter MAP_SCALE_HEIGHT locally (the change applies
# only to the code within the "with" statement)
# It applies (+c) at the middle of the map (no location is appended to +c)
# Without appending text, +l adds the distance unit as label
with pygmt.config(MAP_SCALE_HEIGHT="10p"):
    fig.basemap(map_scale="n0.2/0.15+c+w500k+f+l")

# -----------------------------------------------------------------------------
# Bottom Right: Add a scale bar valid for a specific location
# It is placed at BottomRight (j) using MiddleRight as anchor point (+j) with
# an offset (+o) of 1 centimeter in both x and y directions
# It applies (+c) at -7° South, add a customized label by appending text to +l
fig.basemap(map_scale="jBR+jMR+o1c/1c+c-7+w500k+f+u+lvalid at 7° S")

fig.show()

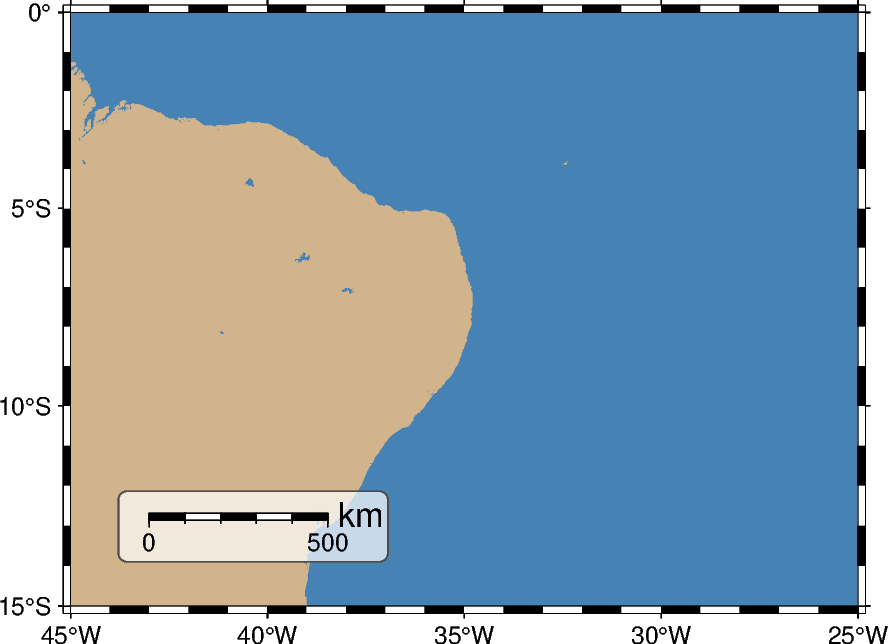
The box parameter allows surrounding the scale bar. This can be useful
when adding a scale bar to a colorful map. To fill the box, append +g
with the desired color (or pattern). The outline of the box can be adjusted
by appending +p with the desired thickness, color, and style. To force
rounded edges append +r with the desired radius.
# Create a new Figure instance
fig = pygmt.Figure()

fig.coast(
    region=[-45, -25, -15, 0],
    projection="M10c",
    land="tan",
    water="steelblue",
    frame=["WSne", "af"],
    # Set the label alignment (+a) to right (r)
    map_scale="jBL+o1c/1c+c-7+w500k+f+lkm+ar",
    # Fill the box in white with a transparency of 30 percent, add a solid
    # outline in darkgray (gray30) with a thickness of 0.5 points, and use
    # rounded edges with a radius of 3 points
    box="+gwhite@30+p0.5p,gray30,solid+r3p",
)

fig.show()

Total running time of the script: (0 minutes 0.337 seconds)