pygmt.project
- pygmt.project(data=None, x=None, y=None, z=None, output_type='pandas', outfile=None, **kwargs)[source]
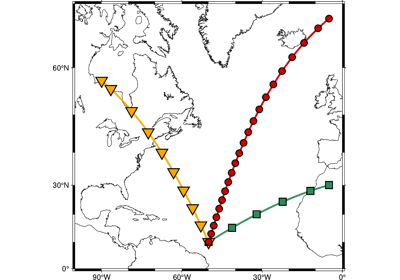
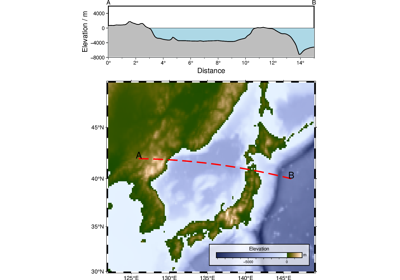
Project data onto lines or great circles, or generate tracks.
Project reads arbitrary \((x, y [, z])\) data and returns any combination of \((x, y, z, p, q, r, s)\), where \((p, q)\) are the coordinates in the projection, \((r, s)\) is the position in the \((x, y)\) coordinate system of the point on the profile (\(q = 0\) path) closest to \((x, y)\), and \(z\) is all remaining columns in the input (beyond the required \(x\) and \(y\) columns).
Alternatively,
projectmay be used to generate \((r, s, p)\) triplets at equal increments along a profile using thegenerateparameter. In this case, the value ofdatais ignored (you can use, e.g.,data=None).Projections are defined in any (but only) one of three ways:
By a
centerand anazimuthin degrees clockwise from North.By a
centerandendpointof the projection path.By a
centerand apoleposition.
To spherically project data along a great circle path, an oblique coordinate system is created which has its equator along that path, and the zero meridian through the Center. Then the oblique longitude (\(p\)) corresponds to the distance from the Center along the great circle, and the oblique latitude (\(q\)) corresponds to the distance perpendicular to the great circle path. When moving in the increasing (\(p\)) direction, (toward B or in the azimuth direction), the positive (\(q\)) direction is to your left. If a Pole has been specified, then the positive (\(q\)) direction is toward the pole.
To specify an oblique projection, use the
poleparameter to set the pole. Then the equator of the projection is already determined and thecenterparameter is used to locate the \(p = 0\) meridian. The center cx/cy will be taken as a point through which the \(p = 0\) meridian passes. If you do not care to choose a particular point, use the South pole (cx = 0, cy = -90).Data can be selectively windowed by using the
lengthandwidthparameters. Ifwidthis used, the projection width is set to use only data with \(w_{min} < q < w_{max}\). Iflengthis set, then the length is set to use only those data with \(l_{min} < p < l_{max}\). If theendpointparameter has been used to define the projection, thenlength="w"may be used to window the length of the projection to exactly the span from O to B.Flat Earth (Cartesian) coordinate transformations can also be made. Set
flat_earth=Trueand remember that azimuth is clockwise from North (the y axis), NOT the usual cartesian theta, which is counterclockwise from the x axis. azimuth = 90 - theta.No assumptions are made regarding the units for \(x, y, r, s, p, q, dist, l_{min}, l_{max}, w_{min}, w_{max}\). If
unitis selected, map units are assumed and \(x, y, r, s\) must be in degrees and \(p, q, dist, l_{min}, l_{max}, w_{min}, w_{max}\) will be in km.Calculations of specific great-circle and geodesic distances or for back-azimuths or azimuths are better done using https://docs.generic-mapping-tools.org/6.5/mapproject as project is strictly spherical.
Full option list at https://docs.generic-mapping-tools.org/6.5/project.html
Aliases:
A = azimuth
C = center
E = endpoint
F = convention
G = generate
L = length
N = flat_earth
Q = unit
S = sort
T = pole
V = verbose
W = width
Z = ellipse
f = coltypes
- Parameters:
data (str, numpy.ndarray, pandas.DataFrame, xarray.Dataset, or geopandas.GeoDataFrame) – Pass in (x, y, z) or (longitude, latitude, elevation) values by providing a file name to an ASCII data table, a 2-D
numpy.ndarray, apandas.DataFrame, anxarray.Datasetmade up of 1-Dxarray.DataArraydata variables, or ageopandas.GeoDataFramecontaining the tabular data.output_type (
Literal['pandas','numpy','file'], default:'pandas') –Desired output type of the result data.
pandaswill return apandas.DataFrameobject.numpywill return anumpy.ndarrayobject.filewill save the result to the file specified by theoutfileparameter.
outfile (
str|None, default:None) – File name for saving the result data. Required ifoutput_type="file". If specified,output_typewill be forced to be"file".center (str or list) – cx/cy. Set the origin of the projection, in Definition 1 or 2. If Definition 3 is used, then cx/cy are the coordinates of a point through which the oblique zero meridian (\(p = 0\)) should pass. The cx/cy is not required to be 90 degrees from the pole.
azimuth (float or str) – Define the azimuth of the projection (Definition 1).
endpoint (str or list) – bx/by. Define the end point of the projection path (Definition 2).
convention (str) – Specify the desired output using any combination of xyzpqrs, in any order [Default is xypqrsz]. Do not space between the letters. Use lower case. The output will be columns of values corresponding to your
convention. The z flag is special and refers to all numerical columns beyond the leading x and y in your input record. The z flag also includes any trailing text (which is placed at the end of the record regardless of the order of z inconvention). Note: Ifgenerateis True, then the output order is hardwired to be rsp andconventionis not allowed.generate (str) – dist [/colat][+c|h]. Create \((r, s, p)\) output data every dist units of \(p\) (See
unitparameter). Alternatively, append /colat for a small circle instead [Default is a colatitude of 90, i.e., a great circle]. If setting a pole withpoleand you want the small circle to go through cx/cy, append +c to compute the required colatitude. Usecenterandendpointto generate a circle that goes through the center and end point. Note, in this case the center and end point cannot be farther apart than \(2|\mbox{colat}|\). Finally, if you append +h then we will report the position of the pole as part of the segment header [Default is no header]. Note: No input is read and the value ofdata,x,y, andzis ignored ifgenerateis used.length (str or list) – [w|l_min/l_max]. Project only those data whose p coordinate is within \(l_{min} < p < l_{max}\). If
endpointhas been set, then you may alternatively use w to stay within the distance fromcentertoendpoint.flat_earth (bool) – Make a Cartesian coordinate transformation in the plane. [Default is
False; plane created with spherical trigonometry.]unit (bool) – Set units for \(x, y, r, s\) to degrees and \(p, q, dist, l_{min}, l_{max}, w_{min}, w_{max}\) to km. [Default is
False; all arguments use the same units]sort (bool) – Sort the output into increasing \(p\) order. Useful when projecting random data into a sequential profile.
pole (str or list) – px/py. Set the position of the rotation pole of the projection. (Definition 3).
Select verbosity level [Default is w], which modulates the messages written to stderr. Choose among 7 levels of verbosity:
q - Quiet, not even fatal error messages are produced
e - Error messages only
w - Warnings [Default]
t - Timings (report runtimes for time-intensive algorithms)
i - Informational messages (same as
verbose=True)c - Compatibility warnings
d - Debugging messages
width (str or list) – w_min/w_max. Project only those data whose \(q\) coordinate is within \(w_{min} < q < w_{max}\).
ellipse (str) – major/minor/azimuth [+e|n]. Used in conjunction with
center(sets its center) andgenerate(sets the distance increment) to create the coordinates of an ellipse with major and minor axes given in km (unlessflat_earthis given for a Cartesian ellipse) and the azimuth of the major axis in degrees. Append +e to adjust the increment set viagenerateso that the the ellipse has equal distance increments [Default uses the given increment and closes the ellipse]. Instead, append +n to set a specific number of unique equidistant data viagenerate. For degenerate ellipses you can just supply a single diameter instead. A geographic diameter may be specified in any desired unit other than km by appending the unit (e.g., 3-D for degrees) [Default is km]; the increment is assumed to be in the same unit. Note: For the Cartesian ellipse (which requiresflat_earth), the direction is counter-clockwise from the horizontal instead of an azimuth.coltypes (str) – [i|o]colinfo. Specify data types of input and/or output columns (time or geographical data). Full documentation is at https://docs.generic-mapping-tools.org/6.5/gmt.html#f-full.
- Return type:
- Returns:
ret – Return type depends on
outfileandoutput_type:Noneifoutfileis set (output will be stored in file set byoutfile)pandas.DataFrameornumpy.ndarrayifoutfileis not set (depends onoutput_type)

