Note
Go to the end to download the full example code.
Plotting polygons
Plotting polygons is handled by the pygmt.Figure.plot method.
This tutorial focuses on input data given as NumPy arrays. Besides NumPy arrays,
array-like objects are supported. Here, a polygon is a closed shape defined by a series
of data points with x and y coordinates, connected by line segments, with the start and
end points being identical. For plotting a geopandas.GeoDataFrame object with
polygon geometries, e.g., to create a choropleth map, see the gallery example
Choropleth map.
import numpy as np
import pygmt
Plot polygons
Set up sample data points as NumPy arrays for the x and y values.
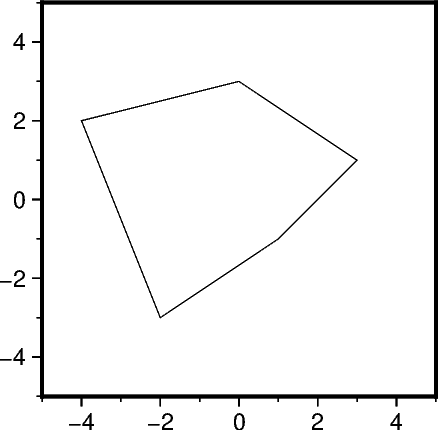
Create a Cartesian plot via the pygmt.Figure.basemap method. Pass arrays to
the x and y parameters of the pygmt.Figure.plot method. Without
further adjustments, lines are drawn between the data points. By default, the lines
are 0.25-points thick, black, and solid. In this example, the data points are chosen
to make the lines form a polygon.
fig = pygmt.Figure()
fig.basemap(region=[-5, 5, -5, 5], projection="X5c", frame=True)
fig.plot(x=x, y=y)
fig.show()
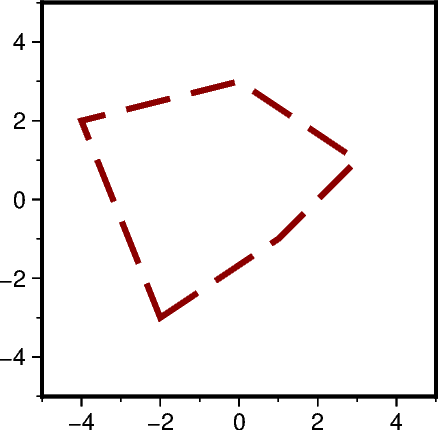
The pen parameter can be used to adjust the lines or outline of the polygon. The
argument passed to pen is one string with the comma-separated optional values
width,color,style.
fig = pygmt.Figure()
fig.basemap(region=[-5, 5, -5, 5], projection="X5c", frame=True)
# Use a 2-points thick, darkred, dashed outline
fig.plot(x=x, y=y, pen="2p,darkred,dashed")
fig.show()
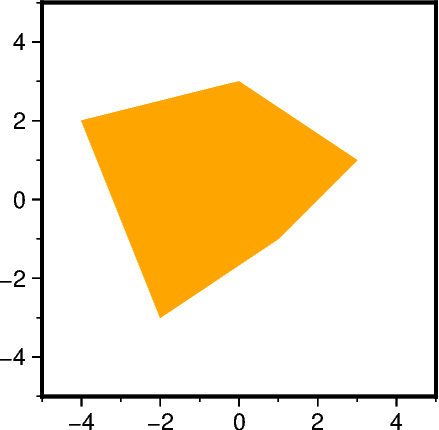
Use the fill parameter to fill the polygon with a color or
pattern. Note, that there are no lines drawn between the
data points by default if fill is used. Use the pen parameter to add an
outline around the polygon.
fig = pygmt.Figure()
fig.basemap(region=[-5, 5, -5, 5], projection="X5c", frame=True)
# Fill the polygon with color "orange"
fig.plot(x=x, y=y, fill="orange")
fig.show()
Close polygons
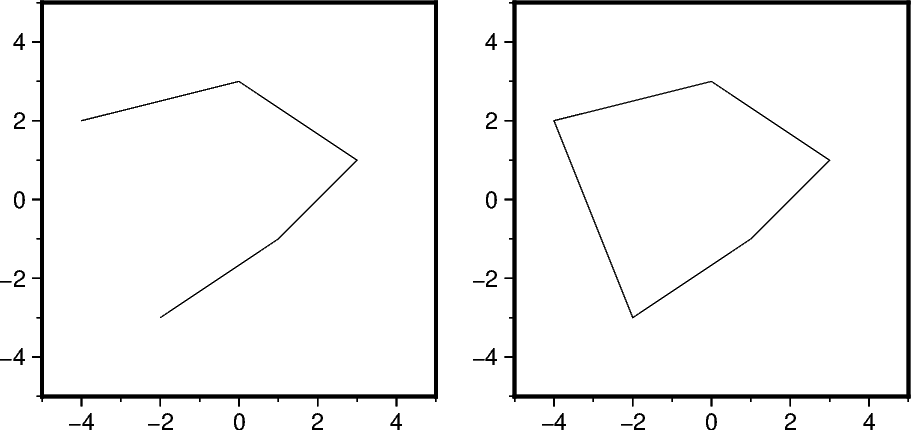
Set up sample data points as NumPy arrays for the x and y values. Now, the data points do not form a polygon.
The close parameter can be used to force the polygon to be closed.
fig = pygmt.Figure()
fig.basemap(region=[-5, 5, -5, 5], projection="X5c", frame=True)
fig.plot(x=x, y=y, pen=True)

fig.shift_origin(xshift="w+1c")

fig.basemap(region=[-5, 5, -5, 5], projection="X5c", frame=True)
fig.plot(x=x, y=y, pen=True, close=True)
fig.show()
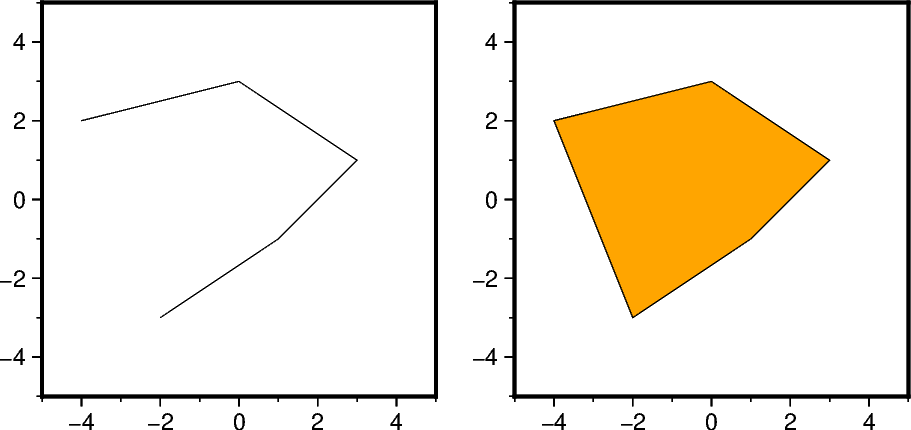
When using the fill parameter, the polygon is automatically closed.
fig = pygmt.Figure()
fig.basemap(region=[-5, 5, -5, 5], projection="X5c", frame=True)
fig.plot(x=x, y=y, pen=True)

fig.shift_origin(xshift="w+1c")

fig.basemap(region=[-5, 5, -5, 5], projection="X5c", frame=True)
fig.plot(x=x, y=y, pen=True, fill="orange")
fig.show()
Total running time of the script: (0 minutes 0.545 seconds)