Note
Go to the end to download the full example code.
Creating legends
The pygmt.Figure.legend method creates legends, whereby auto-legends as well as
manually created legends are supported.
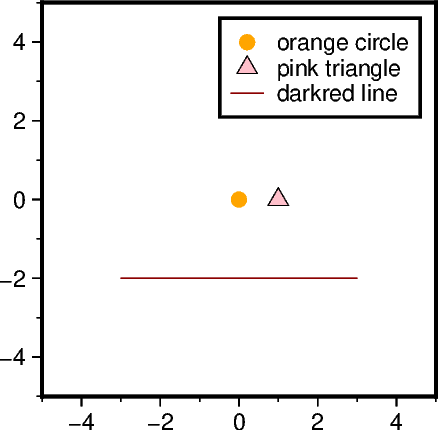
Create an auto-legend
An auto-legend can be created for the methods pygmt.Figure.plot and
pygmt.Figure.plot3d, pygmt.Figure.hlines and
pygmt.Figure.vlines as well as pygmt.Figure.histogram. Therefore the
label parameter has to be specified to state the desired text for the legend entry
(white spaces are supported). Here, we use pygmt.Figure.plot, exemplary. By
default, the legend is placed in the Upper Right corner with an offset of 0.1
centimeters in both x- and y-directions, and surrounded by a box with a white fill and
a 1-point thick, black, solid outline. The order of the legend entries (top to bottom)
is determine by the plotting order. Optionally, to adjust the legend, append different
modifiers to the string passed to label. For a list of available modifiers see
https://docs.generic-mapping-tools.org/6.6/gmt.html#l-full. To create a multiple-column legend +N is used with the desired number of columns.
fig = pygmt.Figure()
fig.basemap(region=[-5, 5, -5, 5], projection="X5c", frame=True)

# Plot two data points and one line
fig.plot(x=0, y=0, style="c0.2c", fill="orange", label="orange circle")
fig.plot(x=1, y=0, style="t0.3c", fill="pink", pen="black", label="pink triangle")
fig.plot(x=[-3, 3], y=[-2, -2], pen="darkred", label="darkred line")

# Add a legend based on the explanation text given via the "label" parameter.
fig.legend()

fig.show()
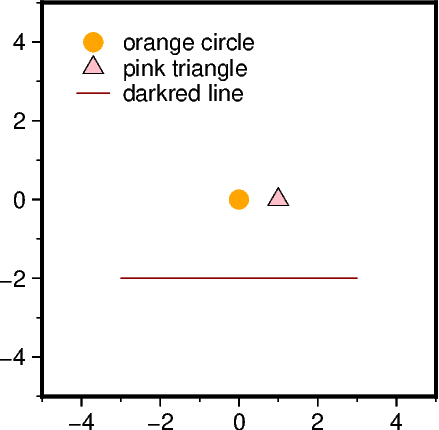
Adjust position and line spacing
Use the position parameter to adjust the position of the legend. Note, no box is
drawn by default if position is used
fig = pygmt.Figure()
fig.basemap(region=[-5, 5, -5, 5], projection="X5c", frame=Frame(axes="rltb"))

fig.plot(x=0, y=0, style="c0.25c", fill="orange", label="orange circle")
fig.plot(x=1, y=0, style="t0.3c", fill="pink", pen="black", label="pink triangle")
fig.plot(x=[-3, 3], y=[-2, -2], pen="darkred", label="darkred line")

# Set the reference point to the Top Left corner inside the plot and use offsets of 0.3
# and 0.2 centimeters in the x- and y-directions, respectively.
fig.legend(position=Position("TL", offset=(0.3, 0.2)))

fig.shift_origin(xshift="w+1c")
fig.basemap(region=[-5, 5, -5, 5], projection="X5c", frame=Frame(axes="rltb"))

fig.plot(x=0, y=0, style="c0.25c", fill="orange", label="orange circle")
fig.plot(x=1, y=0, style="t0.3c", fill="pink", pen="black", label="pink triangle")
fig.plot(x=[-3, 3], y=[-2, -2], pen="darkred", label="darkred line")

# Use a line spacing factor of 1.5
fig.legend(position=Position("TL", offset=(0.3, 0.2)), line_spacing=1.5)

fig.show()
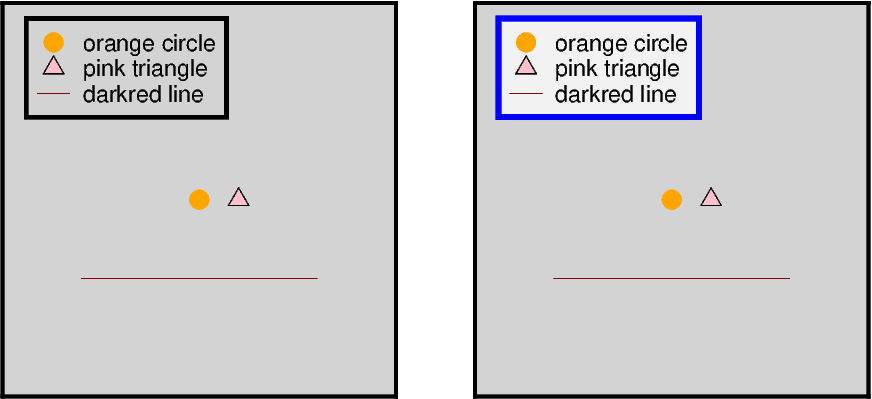
Add a box
# Use the ``box`` parameter for adjusting the box around the legend.

fig = pygmt.Figure()
fig.basemap(
    region=[-5, 5, -5, 5], projection="X5c", frame=Frame(axes="rltb", fill="lightgray")
)

fig.plot(x=0, y=0, style="c0.25c", fill="orange", label="orange circle")
fig.plot(x=1, y=0, style="t0.3c", fill="pink", pen="black", label="pink triangle")
fig.plot(x=[-3, 3], y=[-2, -2], pen="darkred", label="darkred line")

fig.legend(position=Position("TL", offset=(0.3, 0.2)), box=True)

fig.shift_origin(xshift="w+1c")
fig.basemap(
    region=[-5, 5, -5, 5], projection="X5c", frame=Frame(axes="rltb", fill="lightgray")
)

fig.plot(x=0, y=0, style="c0.25c", fill="orange", label="orange circle")
fig.plot(x=1, y=0, style="t0.3c", fill="pink", pen="black", label="pink triangle")
fig.plot(x=[-3, 3], y=[-2, -2], pen="darkred", label="darkred line")

# Add a box with a 2-point thick blue, solid outline and a white fill with a
# transparency of 30 percent ("@30").
fig.legend(
    position=Position("TL", offset=(0.3, 0.2)), box=Box(pen="2p,blue", fill="white@30")
)

fig.show()
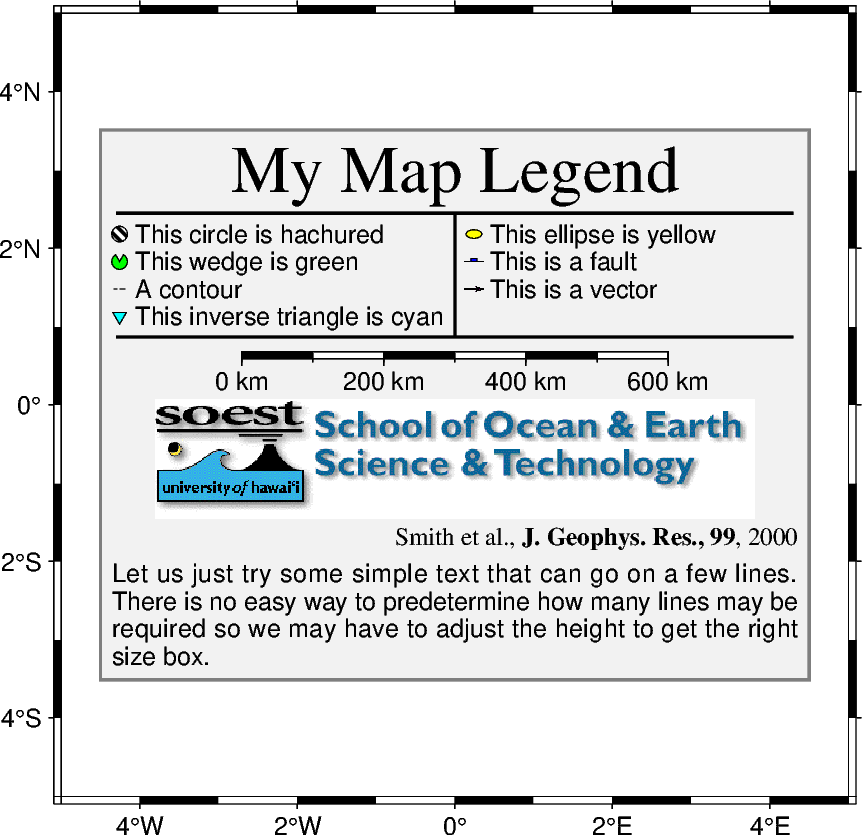
Create a manual legend
For more complicated legends, users need to prepare a legend specification with
instructions for the layout of the legend entries. In PyGMT, the legend specification
can be either an ASCII file or an io.StringIO object. Both are passed to the
spec parameter of pygmt.Figure.legend. Multiple legend codes are available
to create complicated legends. In the example below we show an subset; a full
overview can be found at https://docs.generic-mapping-tools.org/6.6/legend.html#legend-codes. It’s also supported to
include length scales (for geographic projections), faults, and images as well as to
add specific lines.
The following example is orientated on the related GMT example at
https://docs.generic-mapping-tools.org/6.6/legend.html#examples, but modified to use an io.StringIO object.
We start with setting up the io.StringIO object.
spec_io = io.StringIO(
    """
G -0.1c
H 24p,Times-Roman My Map Legend
D 0.2c 1p
N 2
V 0 1p
S 0.1c c 0.20c p300/12 0.25p 0.3c This circle is hachured
S 0.1c e 0.20c yellow 0.25p 0.3c This ellipse is yellow
S 0.1c w 0.20c green 0.25p 0.3c This wedge is green
S 0.1c f 0.25c blue 0.25p 0.3c This is a fault
S 0.1c - 0.15c - 0.25p,- 0.3c A contour
S 0.1c v 0.25c magenta 0.5p 0.3c This is a vector
S 0.1c i 0.20c cyan 0.25p 0.3c This inverse triangle is cyan
D 0.2c 1p
V 0 1p
N 1
G 0.1c
M 5 5 600+u+f
G 0.1c
I @SOEST_block4.png 3i CT
G 0.05c
L 9p,Times-Roman R Smith et al., @%5%J. Geophys. Res., 99@%%, 2000
G 0.1c
T Let us just try some simple text that can go on a few lines.
T There is no easy way to predetermine how many lines may be required
T so we may have to adjust the height to get the right size box.
"""
)
Now, we can add a legend based on this io.StringIO object. For multi-columns
legends, the width must be specified.
fig = pygmt.Figure()
# Note, that we are now using a Mercator projection
fig.basemap(region=[-5, 5, -5, 5], projection="M10c", frame=True)
# Pass the io.StringIO object to the "spec" parameter
fig.legend(
    spec=spec_io, position="MC", width="9c", box=Box(pen="1p,gray50", fill="gray95")
)
fig.show()
Total running time of the script: (0 minutes 0.717 seconds)