Note
Go to the end to download the full example code.
Draping a dataset on top of a topographic surface
It can be visually appealing to “drape” a dataset over a topographic surface. This can
be accomplished using the drape_grid parameter of pygmt.Figure.grdview.
This tutorial consists of two examples:
Draping a grid
Draping an image
# Load the required packages
import pygmt
import rasterio
import xarray as xr
1. Drapping a grid
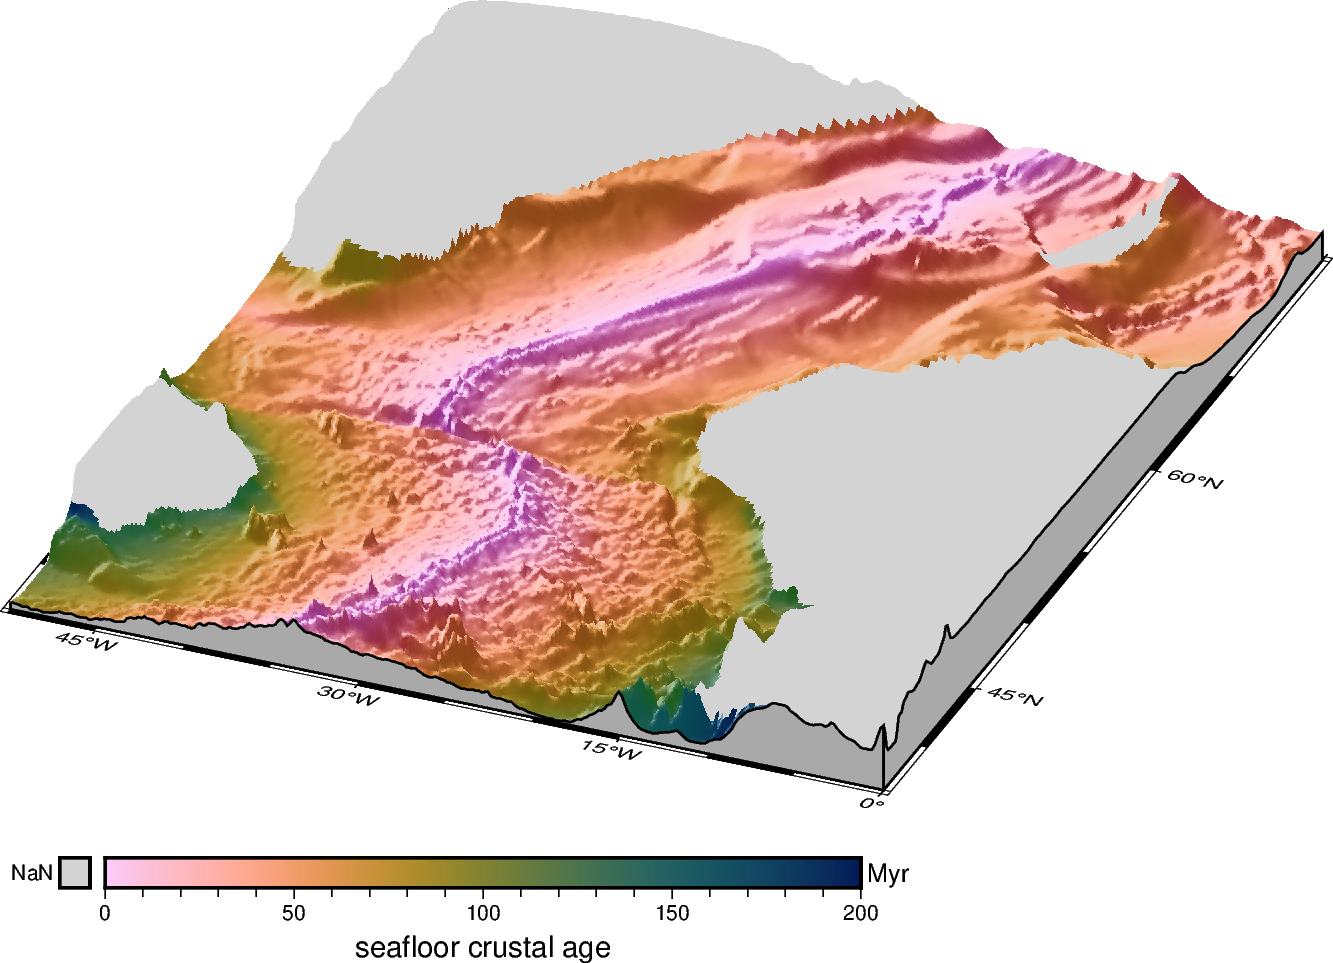
In the first example, the seafloor crustal age is plotted with color-coding on top of the topographic map of an area of the Mid-Atlantic Ridge.
# Define the study area in degrees East or North
region_2d = [-50, 0, 36, 70]  # [lon_min, lon_max, lat_min, lat_max]

# Download elevation and crustal age grids for the study region with a resolution of 10
# arc-minutes and load them into xarray.DataArrays
grd_relief = pygmt.datasets.load_earth_relief(resolution="10m", region=region_2d)
grd_age = pygmt.datasets.load_earth_age(resolution="10m", region=region_2d)

# Determine the 3-D region from the minimum and maximum values of the relief grid
region_3d = [*region_2d, grd_relief.min().to_numpy(), grd_relief.max().to_numpy()]
The topographic surface is created based on the grid passed to the grid parameter
of pygmt.Figure.grdview; here we use a grid of the Earth relief. To add a
color-coding based on another grid we have to pass a second grid to the
drape_grid parameter; here we use a grid of the crustal age. In this case the
colormap specified via the cmap parameter applies to the grid passed to
drape_grid, not to grid. The azimuth and elevation of the 3-D plot are set via
the perspective parameter.
fig = pygmt.Figure()

# Set up colormap for the crustal age
pygmt.config(COLOR_NAN="lightgray")
pygmt.makecpt(cmap="SCM/batlow", series=[0, 200, 1], reverse=True, overrule_bg=True)

fig.grdview(
    projection="M12c",  # Mercator projection with a width of 12 cm
    region=region_3d,
    grid=grd_relief,  # Use elevation grid for z values
    drape_grid=grd_age,  # Use crustal age grid for color-coding
    cmap=True,  # Use colormap created for the crustal age
    surftype="image",  # Create an image plot
    # Use an illumination from the azimuthal directions 0° (north) and 270°
    # (west) with a normalization via a cumulative Laplace distribution for
    # the shading
    shading="+a0/270+ne0.6",
    perspective=[157.5, 30],  # Azimuth and elevation for the 3-D plot
    zsize="1.5c",
    facade_fill="darkgray",
    frame=True,
)

# Add colorbar for the crustal age
fig.colorbar(label="Seafloor crustal age", unit="Myr", nan=True)

fig.show()
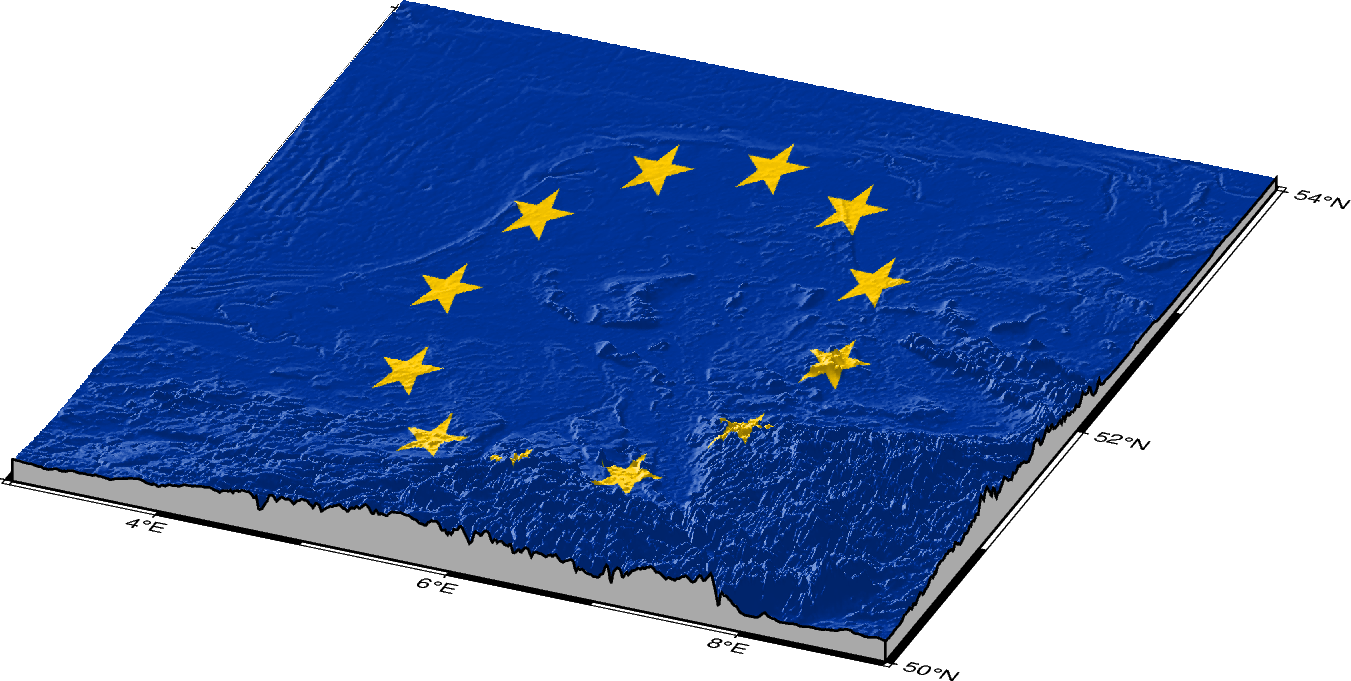
2. Draping an image
In the second example, the flag of the European Union (EU) is plotted on top of a topographic map of northwest Europe. This example is modified from GMT example 32. We have to consider the dimension of the image we want to drap. The image we will download in this example has 1000 x 667 pixels, i.e. an aspect ratio of 3 x 2.
# Define the study area in degrees East or North, with an extend of 6 degrees for
# the longitude and 4 degrees for the latitude
region_2d = [3, 9, 50, 54]  # [lon_min, lon_max, lat_min, lat_max]

# Download elevation grid for the study region with a resolution of 30 arc-seconds and
# pixel registration and load it into an xarray.DataArray
grd_relief = pygmt.datasets.load_earth_relief(resolution="30s", region=region_2d)

# Determine the 3-D region from the minimum and maximum values of the relief grid
region_3d = [*region_2d, grd_relief.min().to_numpy(), grd_relief.max().to_numpy()]

# Load a PNG image of the EU flag using rasterio into an xarray.DataArray.
# The original image is available on Wikimedia Commons at
# https://upload.wikimedia.org/wikipedia/commons/thumb/b/b7/Flag_of_Europe.svg/1024px-Flag_of_Europe.svg.png
# but we use a cached version on the GMT data server.
url_to_image = "https://oceania.generic-mapping-tools.org/cache/euflag.png"
with rasterio.open(url_to_image) as dataset:
    data = dataset.read()
    drape_grid = xr.DataArray(data, dims=("band", "y", "x"))
grdblend [NOTICE]: Remote data courtesy of GMT data server oceania [http://oceania.generic-mapping-tools.org]
grdblend [NOTICE]: SRTM15 Earth Relief v2.7 at 30x30 arc seconds reduced by Gaussian Cartesian filtering (2.6 km fullwidth) [Tozer et al., 2019].
grdblend [NOTICE]:   -> Download 15x15 degree grid tile (earth_relief_30s_g): N45E000
/home/runner/micromamba/envs/pygmt/lib/python3.14/site-packages/rasterio/__init__.py:367: NotGeoreferencedWarning: Dataset has no geotransform, gcps, or rpcs. The identity matrix will be returned.
  dataset = DatasetReader(path, driver=driver, sharing=sharing, thread_safe=thread_safe, **kwargs)
Again we create a 3-D plot with pygmt.Figure.grdview and pass an Earth relief
grid to the grid parameter to create the topographic surface. But now we pass the
PNG image which was loaded into an xarray.DataArray to the drape_grid
parameter.
fig = pygmt.Figure()

# Set up a colormap with two colors for the EU flag: blue (0/51/153) for the background
# (value 0 in the netCDF file -> lower half of 0-255 range) and yellow (255/204/0) for
# the stars (value 255 -> upper half)
pygmt.makecpt(cmap="0/51/153,255/204/0", series=[0, 256, 128])

fig.grdview(
    projection="M12c",  # Mercator projection with a width of 12 cm
    region=region_3d,
    grid=grd_relief,  # Use elevation grid for z values
    drape_grid=drape_grid,  # Drape image grid for the EU flag on top
    cmap=True,  # Use colormap defined for the EU flag
    surftype="image",  # Create an image plot
    # Use an illumination from the azimuthal directions 0° (north) and 270° (west) with
    # a normalization via a cumulative Laplace distribution for the shading
    shading="+a0/270+ne0.6",
    perspective=(157.5, 30),  # Define azimuth, elevation for the 3-D plot
    zsize="1c",
    facade_fill="darkgray",
    frame=True,
)

fig.show()
/home/runner/micromamba/envs/pygmt/lib/python3.14/site-packages/rasterio/__init__.py:377: NotGeoreferencedWarning: The given matrix is equal to Affine.identity or its flipped counterpart. GDAL may ignore this matrix and save no geotransform without raising an error. This behavior is somewhat driver-specific.
  dataset = writer(
Total running time of the script: (0 minutes 6.622 seconds)