Note
Go to the end to download the full example code.
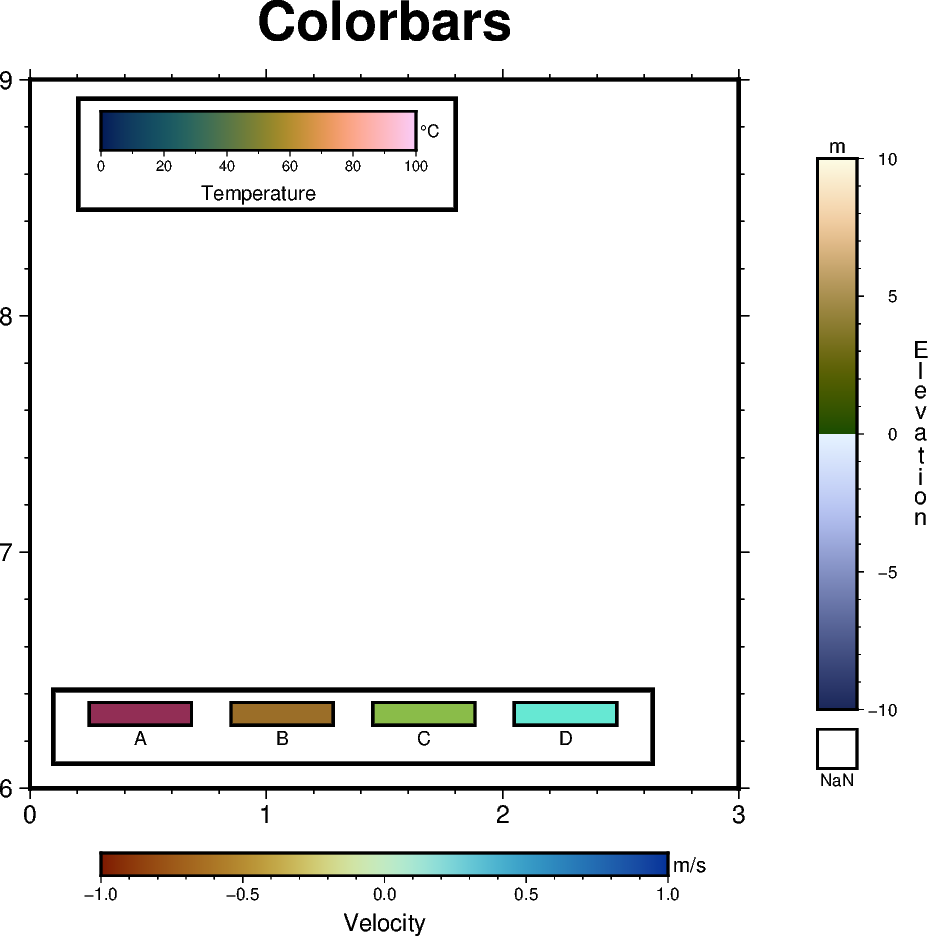
Colorbar
The pygmt.Figure.colorbar method creates a color scalebar. The colormap is set
via the cmap parameter. A full list of available color palette tables can be found
at https://docs.generic-mapping-tools.org/6.6/reference/cpts.html. Use the label and unit parameters to set the
labels along the long and short dimensions of the colorbar, respectively. To set the
annotation and tick intervals, use the annot and tick parameters. The placement
of the colorbar is set by passing a pygmt.params.Position object to the
position parameter.
import pygmt
from pygmt.params import Axis, Frame, Position

fig = pygmt.Figure()
fig.basemap(
    region=[0, 3, 6, 9],
    projection="x3c",
    frame=Frame(axes="WSne", title="Colorbars", axis=Axis(annot=True, tick=True)),
)

# ============
# Create a colorbar designed for seismic tomography - roma
# Colorbar is placed at Bottom Center (BC) by default if no position is given
fig.colorbar(cmap="SCM/roma", annot=0.5, tick=0.1, label="Velocity", unit="m/s")

# ============
# Create a colorbar showing the scientific rainbow - batlow
fig.colorbar(
    cmap="SCM/batlow",
    # A horizontal colorbar positioned at map coordinates (0.3, 8.7).
    position=Position((0.3, 8.7), cstype="mapcoords"),
    length=4,
    width=0.5,
    orientation="horizontal",
    box=True,
    label="Temperature",
    unit="°C",
    scale=100,
)

# ============
# Create a colorbar suitable for surface topography - oleron
fig.colorbar(
    cmap="SCM/oleron",
    # Colorbar placed at Middle Right (MR) outside the plot bounding box, offset by 1 cm
    # horizontally and 0 cm vertically from anchor point, with a rectangle for NaN
    # values. Note that the label 'Elevation' is plotted vertically as a column of
    # characters.
    position=Position("MR", cstype="outside", offset=(1, 0)),
    length=7,
    width=0.5,
    nan=True,
    label_as_column=True,
    label="Elevation",
    unit="m",
    scale=10,
)

# ============
# Create a colorbar suitable for categorical data - hawaii
# Set up the colormap
pygmt.makecpt(
    cmap="SCM/hawaii",
    series=[0, 3, 1],
    # Comma-separated string for the annotations of the colorbar
    color_model="+cA,B,C,D",
)
# Plot the colorbar
fig.colorbar(
    cmap=True,  # Use colormap set up above
    # Colorbar placed in the Bottom Left (BL) corner inside the plot bounding box, with
    # an offset by 0.5 cm horizontally and 0.8 cm vertically from the anchor point, and
    # plotted horizontally.
    position=Position("BL", offset=(0.5, 0.8)),
    orientation="horizontal",
    box=True,
    # Divide colorbar into equal-sized rectangles
    equalsize=0.5,
)

fig.show()
Total running time of the script: (0 minutes 0.168 seconds)