pygmt.Figure.image
- Figure.image(imagefile, position=None, width=None, height=None, dpi=None, replicate=None, box=False, monochrome=False, invert=False, projection=None, region=None, frame=False, verbose=False, panel=False, perspective=False, transparency=None, **kwargs)
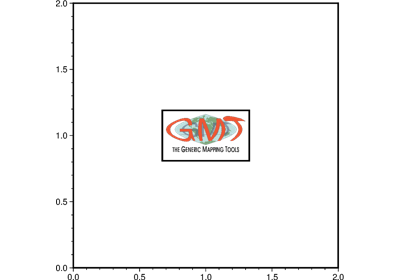
Plot raster or EPS images.
Reads an Encapsulated PostScript file or a raster image file and plot it on a map. The image can be scaled arbitrarily, and 1-bit raster images can be:
inverted, i.e., black pixels (on) become white (off) and vice versa.
colorized, by assigning different foreground and background colors.
made transparent where either the back- or foreground is painted.
As an option, the user may choose to convert colored raster images to grayscale using TV’s YIQ-transformation. For raster files, the user can select which color is made transparent. The user may also choose to replicate the image which, when preceded by appropriate clip paths, may allow larger custom-designed fill patterns to be implemented.
Full GMT docs at https://docs.generic-mapping-tools.org/6.6/image.html.
Aliases:
G = bitcolor
B = frame
D = position, +w: width/height, +r: dpi, +n: replicate
F = box
I = invert
J = projection
M = monochrome
R = region
V = verbose
c = panel
p = perspective
t = transparency
- Parameters:
imagefile (
str|PathLike) – An Encapsulated PostScript (EPS) file or a raster image file. An EPS file must contain an appropriate BoundingBox. A raster file can have a depth of 1, 8, 24, or 32 bits and is read via GDAL.position (
Position|Sequence[float|str] |Literal['TL','TC','TR','ML','MC','MR','BL','BC','BR'] |None, default:None) –Position of the GMT logo on the plot. It can be specified in multiple ways:
A
pygmt.params.Positionobject to fully control the reference point, anchor point, and offset.A sequence of two values representing the x- and y-coordinates in plot coordinates, e.g.,
(1, 2)or("1c", "2c").A 2-character justification code for a position inside the plot, e.g.,
"TL"for Top Left corner inside the plot.
If not specified, defaults to the Bottom Left corner of the plot (position
(0, 0)with anchor"BL").height (
float|str|None, default:None) – Width (and height) of the image in plot coordinates (inches, cm, etc.). Ifheight(orwidth) is set to 0, then the original aspect ratio of the image is maintained. Ifwidth(orheight) is negative, the absolute value is used to interpolate image to the device resolution using the PostScript image operator. If neither dimensions nordpiare set then revert to the default dpi [GMT_GRAPHICS_DPU].dpi (
float|str|None, default:None) – Set the dpi of the image in dots per inch, or append c to indicate this is dots per cm.replicate (
int|Sequence[int] |None, default:None) – nx or (nx, ny). Replicate the (scaled) image nx times in the horizontal direction, and ny times in the vertical direction. If a single integer nx is given, ny = nx. [Default is (1, 1)].box (
Box|bool, default:False) – Draw a background box behind the image. If set toTrue, a simple rectangular box is drawn using MAP_FRAME_PEN. To customize the box appearance, pass apygmt.params.Boxobject to control style, fill, pen, and other box properties.bitcolor (str or list) – [color][+b|f|t]. Change certain pixel values to another color or make them transparent. For 1-bit images you can specify an alternate color for the background (+b) or the foreground (+f) pixels, or give no color to make those pixels transparent. Can be repeated with different settings. Alternatively, for color images you can select a single color that should be made transparent instead (+t).
monochrome (
bool, default:False) – Convert color image to monochrome grayshades using the (television) YIQ-transformation.invert (
bool, default:False) –Invert 1-bit image before plotting, i.e., black pixels (on) become white (off) and vice versa. Ignored if used with color images.
Note: There was an upstream GMT bug, so this feature may not work correctly for some 1-bit images for GMT<=6.6.0. See PR #8837.
projection (
str|None, default:None) – projcode[projparams/]width|scale. Select map projection.region (str or list) – xmin/xmax/ymin/ymax[+r][+uunit]. Specify the region of interest.
frame (bool, str, or list) – Set map boundary frame and axes attributes.
verbose (bool or str) – Select verbosity level [Full usage].
panel (
int|Sequence[int] |bool, default:False) –Select a specific subplot panel. Only allowed when used in
Figure.subplotmode.Trueto advance to the next panel in the selected order.index to specify the index of the desired panel.
(row, col) to specify the row and column of the desired panel.
The panel order is determined by the
Figure.subplotmethod. row, col and index all start at 0.perspective (
float|Sequence[float] |str|bool, default:False) –Select perspective view and set the azimuth and elevation of the viewpoint.
Accepts a single value or a sequence of two or three values: azimuth, (azimuth, elevation), or (azimuth, elevation, zlevel).
azimuth: Azimuth angle of the viewpoint in degrees [Default is 180, i.e., looking from south to north].
elevation: Elevation angle of the viewpoint above the horizon [Default is 90, i.e., looking straight down at nadir].
zlevel: Z-level at which 2-D elements (e.g., the map frame) are drawn. Only applied when used together with
zsizeorzscale. [Default is at the bottom of the z-axis].
Alternatively, set
perspective=Trueto reuse the perspective setting from the previous plotting method, or pass a string following the full GMT syntax for finer control (e.g., adding+wor+vmodifiers to select an axis location other than the plot origin). See https://docs.generic-mapping-tools.org/6.6/gmt.html#perspective-full for details.transparency (float) – Set transparency level, in [0-100] percent range [Default is
0, i.e., opaque]. Only visible when PDF or raster format output is selected. Only the PNG format selection adds a transparency layer in the image (for further processing).
