Note
Go to the end to download the full example code.
Oblique Mercator projection
Oblique configurations of the cylinder give rise to the oblique Mercator projection. It is particularly useful when mapping regions of large lateral extent in an oblique direction. Both parallels and meridians are complex curves. The projection was developed in the early 1900s by several workers.
The projection is set with o or O. There are three different specification ways (a|A, b|B, c|C) available. For all three definitions, the uppercase letter mean the projection pole is set in the southern hemisphere [Default is northern hemisphere]. Align the y-axis with the optional modifier +v. The figure size is set with scale or width.
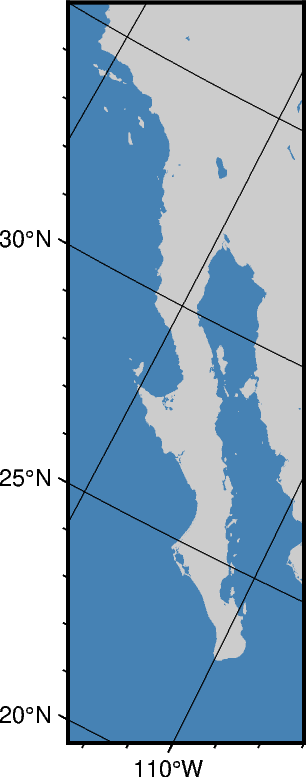
1. Using the origin and azimuth
oa|oAlon0/lat0/azimuth/scale[+v] or Oa|OAlon0/lat0/azimuth/width[+v]
The central meridian is set by lon0/lat0. The oblique equator is set by azimuth.
import pygmt

fig = pygmt.Figure()
fig.coast(
    projection="Oa-120/25/-30/3c+v",
    # Set bottom left and top right coordinates of the figure with "+r"
    region="-122/35/-107/22+r",
    frame="afg",
    land="gray80",
    water="steelblue",
)
fig.show()
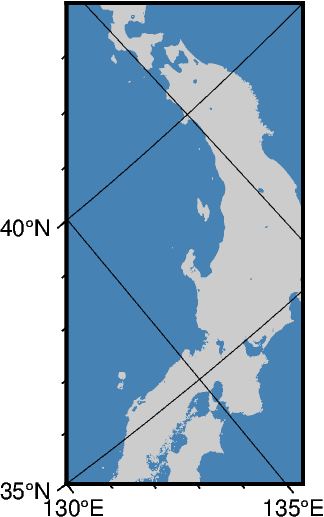
2. Using two points
ob|oBlon0/lat0/lon1/lat1/scale[+v] or Ob|OBlon0/lat0/lon1/lat1/width[+v]
The central meridian is set by lon0/lat0. The oblique equator is set by lon1/lat1.
fig = pygmt.Figure()
fig.coast(
    projection="Ob130/35/25/35/3c",
    region="130/35/145/40+r",
    frame="afg",
    land="gray80",
    water="steelblue",
)
fig.show()
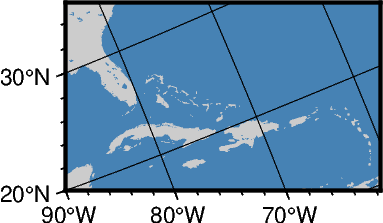
3. Using the origin and projection pole
oc|oClon0/lat0/lonp/latp/scale[+v] or Oc|OClon0/lat0/lonp/latp/width[+v]
The central meridian is set by lon0/lat0. The projection pole is set by lonp/latp.
fig = pygmt.Figure()
fig.coast(
    projection="Oc280/25.5/22/69/4c",
    region="270/20/305/25+r",
    frame="afg",
    land="gray80",
    water="steelblue",
)
fig.show()
Total running time of the script: (0 minutes 0.387 seconds)