Note
Go to the end to download the full example code.
Custom symbols
The pygmt.Figure.plot method can plot individual custom symbols by
passing the corresponding symbol name together with the k shortcut to the
style parameter.
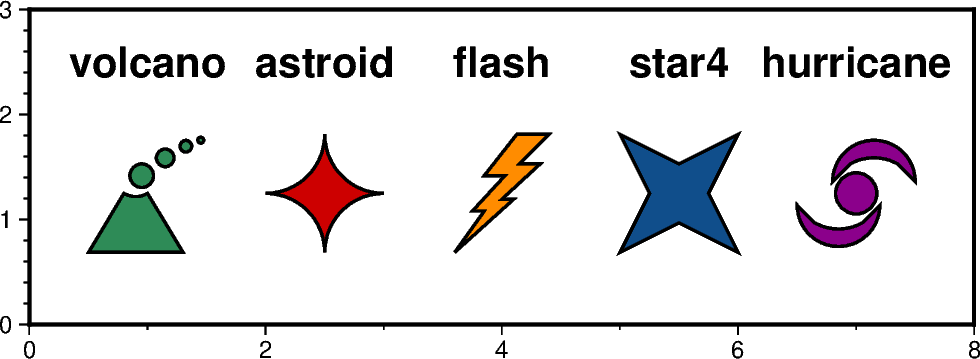
In total 41 custom symbols are already included of which the following plot shows five exemplary ones. The symbols are shown underneath their corresponding names. For the remaining symbols see the GMT Technical Reference https://docs.generic-mapping-tools.org/6.5/reference/custom-symbols.html.
Beside these built-in custom symbols GMT allows users to define their own custom symbols. For this, a specific macro language is used. A detailed introduction can be found at https://docs.generic-mapping-tools.org/6.5/reference/custom-symbols.html#the-macro-language. After defining such a symbol it can be used in the same way as a built-in custom symbol.
Please note: Custom symbols can not be used in auto-legends yet.
import pygmt

fig = pygmt.Figure()
fig.basemap(region=[0, 8, 0, 3], projection="X12c/4c", frame=True)

# Define pen and fontstyle for annotations
pen = "1p,black"
font = "15p,Helvetica-Bold"

# Use the volcano symbol with a size of 1.5c, fill color is set to "seagreen"
fig.plot(x=1, y=1.25, style="kvolcano/1.5c", pen=pen, fill="seagreen")
fig.text(x=1, y=2.5, text="volcano", font=font)

# Use the astroid symbol with a size of 1.5c, fill color is set to "red3"
fig.plot(x=2.5, y=1.25, style="kastroid/1.5c", pen=pen, fill="red3")
fig.text(x=2.5, y=2.5, text="astroid", font=font)

# Use the flash symbol with a size of 1.5c, fill color is set to "darkorange"
fig.plot(x=4, y=1.25, style="kflash/1.5c", pen=pen, fill="darkorange")
fig.text(x=4, y=2.5, text="flash", font=font)

# Use the star4 symbol with a size of 1.5c, fill color is set to "dodgerblue4"
fig.plot(x=5.5, y=1.25, style="kstar4/1.5c", pen=pen, fill="dodgerblue4")
fig.text(x=5.5, y=2.5, text="star4", font=font)

# Use the hurricane symbol with a size of 1.5c, fill color is set to "magenta4"
fig.plot(x=7, y=1.25, style="khurricane/1.5c", pen=pen, fill="magenta4")
fig.text(x=7, y=2.5, text="hurricane", font=font)

fig.show()
Total running time of the script: (0 minutes 0.143 seconds)