pygmt.datasets.load_earth_magnetic_anomaly
- pygmt.datasets.load_earth_magnetic_anomaly(resolution='01d', region=None, registration=None, data_source='emag2')[source]
Load the Earth magnetic anomaly datasets in various resolutions.
Earth Magnetic Anomaly Model (EMAG2)
World Digital Magnetic Anomaly Map (WDMAM)
This function downloads the dataset from the GMT data server, caches it in a user data directory (usually
~/.gmt/server/earth/earth_mag/,~/.gmt/server/earth/earth_mag4km/,~/.gmt/server/earth/earth_wdmam/), and load the dataset as anxarray.DataArray. An internet connection is required the first time around, but subsequent calls will load the dataset from the local data directory.The dataset can also be accessed by specifying a file name in any grid processing function or plotting method, using the following file name format: @earth_mag_type_res_reg. earth_mag_type is the GMT name for the dataset. The available options are earth_mag, earth_mag4km, and earth_wdmam; res is the grid resolution; reg is the grid registration type (p for pixel registration, g for gridline registration). If reg is omitted (e.g.,
@earth_mag_01d), the gridline-registered grid will be loaded for grid processing functions and the pixel-registered grid will be loaded for plotting functions. If res is also omitted (i.e.,@earth_mag), GMT automatically selects a suitable resolution based on the current region and projection settings.The default color palette tables (CPTs) for this dataset are
@earth_mag.cptfordata_source="emag2"anddata_source="emag2_4km", and@earth_wdmam.cptfordata_source="wdmam". To use the dataset-specific CPT when plotting the dataset, explicitly setcmap="@earth_mag.cpt"orcmap="@earth_wdmam.cpt", otherwise GMT’s default CPT (turbo) will be used. If the dataset is referenced by the file name in a grid plotting method, the dataset-specific CPT file is used automatically unless another CPT is specified.Refer to https://www.generic-mapping-tools.org/remote-datasets/earth-mag.html and https://www.generic-mapping-tools.org/remote-datasets/earth-wdmam.html for more details about available datasets, including version information and references.
- Parameters:
resolution (
Literal['01d','30m','20m','15m','10m','06m','05m','04m','03m','02m'], default:'01d') – The grid resolution. The suffixdandmstand for arc-degrees and arc-minutes. The resolution"02m"is not available fordata_source="wdmam".region (
Sequence[float] |str|None, default:None) – The subregion of the grid to load, in the form of a sequence [xmin, xmax, ymin, ymax] or an ISO country code. Required for grids with resolutions higher than 5 arc-minutes (i.e.,"05m").registration (
Literal['gridline','pixel',None], default:None) – Grid registration type. Either"pixel"for pixel registration or"gridline"for gridline registration. Default isNone, which means"gridline"for all resolutions except"02m"fordata_source="emag2"ordata_source="emag2_4km", which are"pixel"only.data_source (
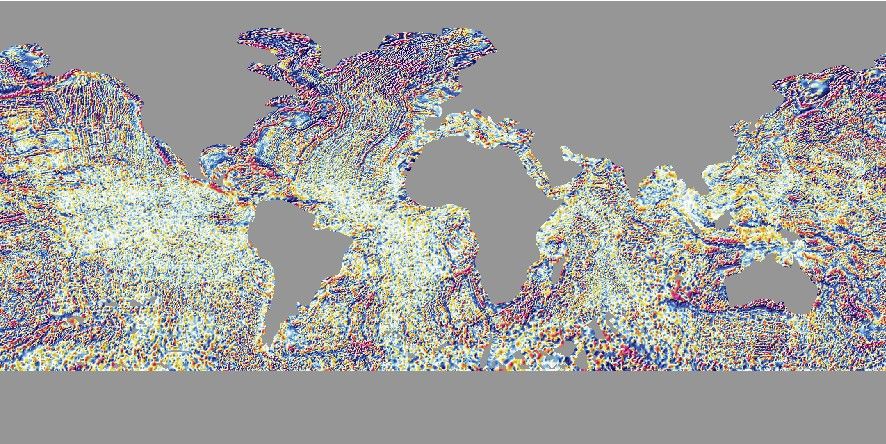
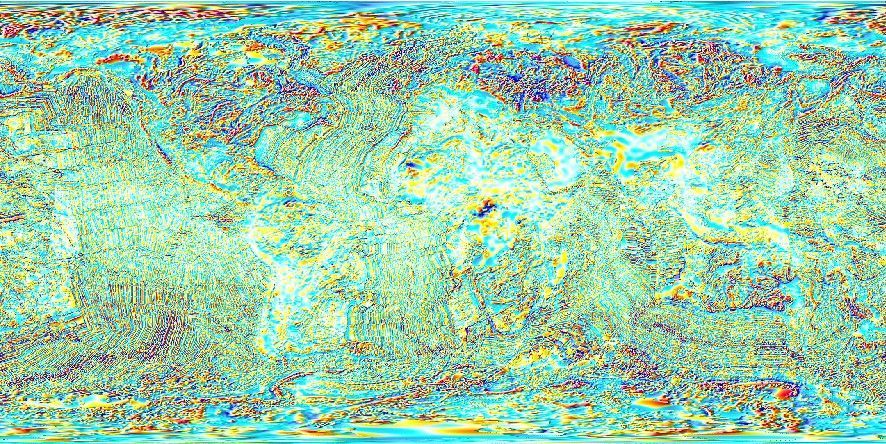
Literal['emag2','emag2_4km','wdmam'], default:'emag2') –Select the source of the magnetic anomaly data. Available options are:
"emag2": EMAG2 Earth Magnetic Anomaly Model. It only includes data observed at sea level over oceanic regions. See https://www.generic-mapping-tools.org/remote-datasets/earth-mag.html."emag2_4km": Use a version of EMAG2 where all observations are relative to an altitude of 4 km above the geoid and include data over land."wdmam": World Digital Magnetic Anomaly Map (WDMAM). See https://www.generic-mapping-tools.org/remote-datasets/earth-wdmam.html.
- Return type:
- Returns:
grid – The Earth magnetic anomaly grid. Coordinates are latitude and longitude in degrees. Units are in nano Tesla (nT).
Note
The registration and coordinate system type of the returned
xarray.DataArraygrid can be accessed via the GMT accessors (i.e.,grid.gmt.registrationandgrid.gmt.gtyperespectively). However, these properties may be lost after specific grid operations (such as slicing) and will need to be manually set before passing the grid to any PyGMT data processing or plotting functions. Refer topygmt.GMTDataArrayAccessorfor detailed explanations and workarounds.Examples
>>> from pygmt.datasets import load_earth_magnetic_anomaly
>>> # Load the default grid (gridline-registered 1 arc-degree grid)
>>> grid = load_earth_magnetic_anomaly()
>>> # Load the 30 arc-minutes grid with "gridline" registration
>>> grid = load_earth_magnetic_anomaly(resolution="30m", registration="gridline")
>>> # Load high-resolution (5 arc-minutes) grid for a specific region
>>> grid = load_earth_magnetic_anomaly(
...     resolution="05m",
...     region=[120, 160, 30, 60],
...     registration="gridline",
... )
>>> # Load the 20 arc-minutes grid of the emag2_4km dataset
>>> grid = load_earth_magnetic_anomaly(
...     resolution="20m", registration="gridline", data_source="emag2_4km"
... )
>>> # Load the 20 arc-minutes grid of the WDMAM dataset
>>> grid = load_earth_magnetic_anomaly(
...     resolution="20m", registration="gridline", data_source="wdmam"
... )