Note
Go to the end to download the full example code.
Oblique Mercator projection
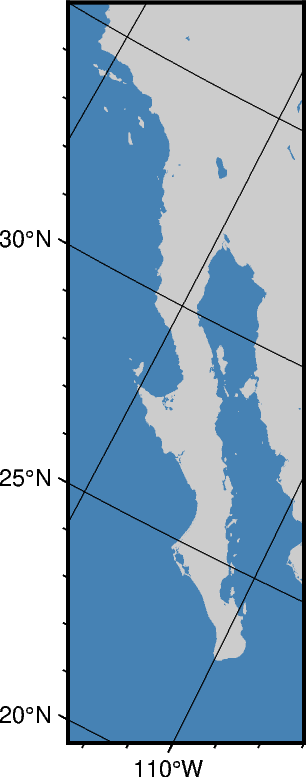
Oblique configurations of the cylinder give rise to the oblique Mercator projection. It is particularly useful when mapping regions of large lateral extent in an oblique direction. Both parallels and meridians are complex curves. The projection was developed in the early 1900s by several workers.
The projection is set with o or O. There are three different specification ways (a|A, b|B, c|C) available. For all three definitions, the uppercase letter means the projection pole is set in the southern hemisphere [Default is northern hemisphere].
1. Using the origin and azimuth
oa|oAlon0/lat0/azimuth/scale[+v] or Oa|OAlon0/lat0/azimuth/width[+v]
lon0/lat0: Sets the projection center.
azimuth: Sets the azimuth of the oblique equator.
scale or width: Sets the map size.
+v: Aligns the oblique equator with the y-axis [Optional].
2. Using two points
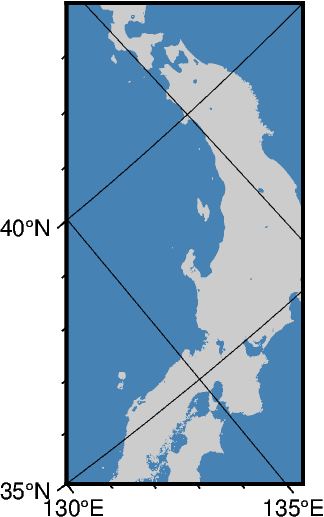
ob|oBlon0/lat0/lon1/lat1/scale[+v] or Ob|OBlon0/lat0/lon1/lat1/width[+v]
lon0/lat0: Sets the projection center.
lon1/lat1: Sets a second point on the oblique equator.
scale or width: Sets the map size.
+v: Aligns the oblique equator with the y-axis [Optional].
fig = pygmt.Figure()
fig.coast(
    projection="Ob130/35/25/35/3c",
    region="130/35/145/40+r",
    frame=Axis(annot=True, tick=True, grid=True),
    land="gray80",
    water="steelblue",
)
fig.show()
3. Using the origin and projection pole
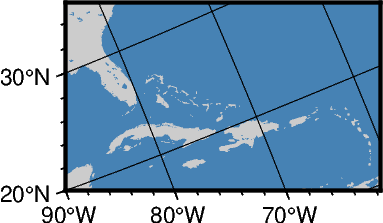
oc|oClon0/lat0/lonp/latp/scale[+v] or Oc|OClon0/lat0/lonp/latp/width[+v]
lon0/lat0: Sets the projection center.
lonp/latp: Sets the projection pole.
scale or width: Sets the map size.
+v: Aligns the oblique equator with the y-axis [Optional].
fig = pygmt.Figure()
fig.coast(
    projection="Oc280/25.5/22/69/4c",
    region="270/20/305/25+r",
    frame=Axis(annot=True, tick=True, grid=True),
    land="gray80",
    water="steelblue",
)
fig.show()
Total running time of the script: (0 minutes 0.249 seconds)