Note
Go to the end to download the full example code.
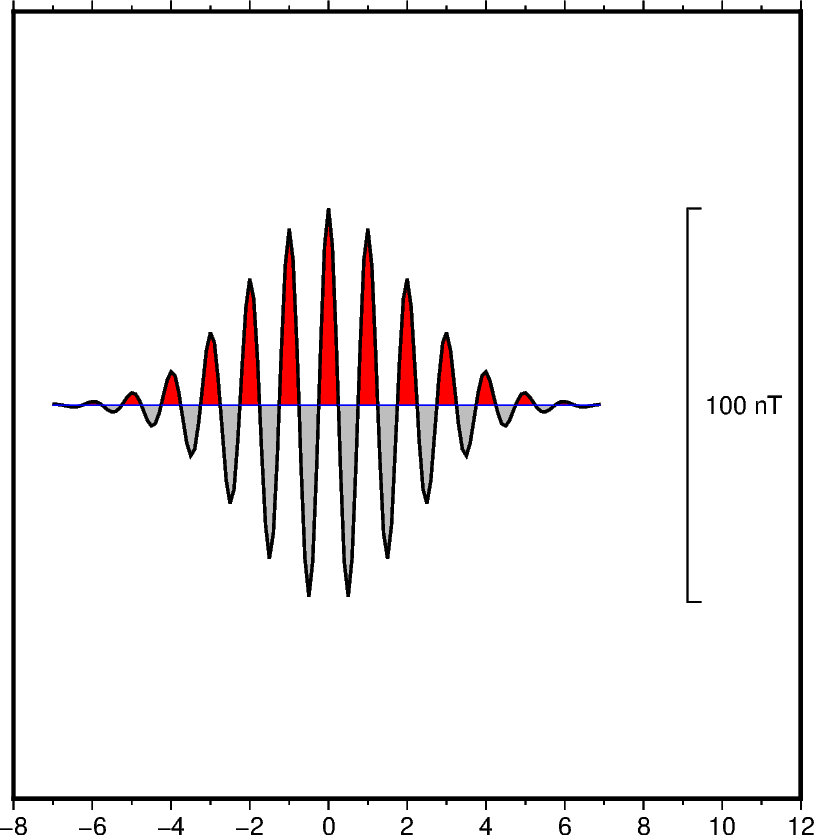
Wiggle along tracks
The pygmt.Figure.wiggle method can plot z = f(x,y) anomalies along tracks.
x, y, z can be specified as 1-D arrays or within a specified file. The
scale parameter can be used to set the scale of the anomaly in data/distance units.
The positive and/or negative areas can be filled with color by setting the
positive_fill and/or negative_fill parameters.
import numpy as np
import pygmt
from pygmt.params import Axis, Frame, Position

# Create (x, y, z) triplets
x = np.arange(-7, 7, 0.1)
y = np.zeros(x.size)
z = 50 * np.exp(-((x / 3) ** 2)) * np.cos(2 * np.pi * x)

fig = pygmt.Figure()
fig.basemap(
    region=[-8, 12, -1, 1],
    projection="X10c",
    frame=Frame(axes="Snlr", xaxis=Axis(annot=2, tick=1)),
)
fig.wiggle(
    x=x,
    y=y,
    z=z,
    scale="20c",  # Set anomaly scale to 20 centimeters
    positive_fill="red",  # Fill positive areas red
    negative_fill="gray",  # Fill negative areas gray
    pen="1.0p",  # Set the outline width to 1.0 point
    track="0.5p,blue",  # Draw a blue track with a width of 0.5 points
    position=Position("MR"),  # Plot a vertical scale bar at Middle Right (MR).
    length=100,  # Bar length is 100 in data (z) units.
    label="nT",  # Set the z unit label to "nT".
)
fig.show()
Total running time of the script: (0 minutes 0.128 seconds)