pygmt.makecpt
- pygmt.makecpt(*, transparency=None, cmap=None, background=None, color_model=None, truncate=None, output=None, reverse=None, overrule_bg=None, no_bg=None, log=None, series=None, verbose=None, categorical=None, cyclic=None, continuous=None, **kwargs)[source]
Make GMT color palette tables.
This is a function that will help you make static color palette tables (CPTs). By default, the CPT will simply be saved to the current session, but you can use
outputto save it to a file. You define an equidistant set of contour intervals or pass your own z-table or list, and create a new CPT based on an existing master (dynamic) CPT. The resulting CPT can be reversed relative to the master cpt, and can be made continuous or discrete. For color tables beyond the standard GMT offerings, visit cpt-city and Scientific Colour-Maps.The CPT includes three additional colors beyond the range of z-values. These are the background color (B) assigned to values lower than the lowest z-value, the foreground color (F) assigned to values higher than the highest z-value, and the NaN color (N) painted wherever values are undefined.
If the master CPT includes B, F, and N entries, these will be copied into the new master file. If not, the parameters COLOR_BACKGROUND, COLOR_FOREGROUND, and COLOR_NAN from the gmt.conf file will be used. This default behavior can be overruled using the parameters
background,overrule_bgorno_bg.The color model (RGB, HSV or CMYK) of the palette created by
pygmt.makecptwill be the same as specified in the header of the master CPT. When there is no COLOR_MODEL entry in the master CPT, the COLOR_MODEL specified in the gmt.conf file will be used.Full option list at https://docs.generic-mapping-tools.org/latest/makecpt.html
Aliases:
A = transparency
C = cmap
D = background
F = color_model
G = truncate
H = output
I = reverse
M = overrule_bg
N = no_bg
Q = log
T = series
V = verbose
W = categorical
Ww = cyclic
Z = continuous
- Parameters
transparency (str) – Set a constant level of transparency (0-100) for all color slices. Append +a to also affect the foreground, background, and NaN colors [Default is no transparency, i.e.,
0(opaque)].cmap (str) – Select the master color palette table (CPT) to use in the interpolation. Full list of built-in color palette tables can be found at https://docs.generic-mapping-tools.org/latest/cookbook/cpts.html#built-in-color-palette-tables-cpt.
background (bool or str) – Select the back- and foreground colors to match the colors for lowest and highest z-values in the output CPT [Default (
background=Trueorbackground="o") uses the colors specified in the master file, or those defined by the parameters COLOR_BACKGROUND, COLOR_FOREGROUND, and COLOR_NAN]. Usebackground="i"to match the colors for the lowest and highest values in the input (instead of the output) CPT.color_model – [R|r|h|c][+c[label]]. Force output CPT to be written with r/g/b codes, gray-scale values or color name (R, default) or r/g/b codes only (r), or h-s-v codes (h), or c/m/y/k codes (c). Optionally or alternatively, append +c to write discrete palettes in categorical format. If label is appended then we create labels for each category to be used when the CPT is plotted. The label may be a comma-separated list of category names (you can skip a category by not giving a name), or give start[-], where we automatically build monotonically increasing labels from start (a single letter or an integer). Append - to build ranges start-start+1 instead.
series (list or str) – [min/max/inc[+b|l|n]|file|list]. Define the range of the new CPT by giving the lowest and highest z-value (and optionally an interval). If this is not given, the existing range in the master CPT will be used intact. The values produced defines the color slice boundaries. If +n is used it refers to the number of such boundaries and not the number of slices. For details on array creation, see https://docs.generic-mapping-tools.org/latest/makecpt.html#generate-1d-array.
truncate (list or str) – zlow/zhigh. Truncate the incoming CPT so that the lowest and highest z-levels are to zlow and zhigh. If one of these equal NaN then we leave that end of the CPT alone. The truncation takes place before any resampling. See also https://docs.generic-mapping-tools.org/latest/cookbook/features.html#manipulating-cpts.
output (str) – Optional. The file name with extension .cpt to store the generated CPT file. If not given or False [Default], saves the CPT as the session current CPT.
reverse (str) – Set this to True or c [Default] to reverse the sense of color progression in the master CPT. Set this to z to reverse the sign of z-values in the color table. Note that this change of z-direction happens before
truncateandseriesvalues are used so the latter must be compatible with the changed z-range. See also https://docs.generic-mapping-tools.org/latest/cookbook/features.html#manipulating-cpts.overrule_bg (str) – Overrule background, foreground, and NaN colors specified in the master CPT with the values of the parameters COLOR_BACKGROUND, COLOR_FOREGROUND, and COLOR_NAN specified in the gmt.conf file. When combined with
background, only COLOR_NAN is considered.no_bg (bool) – Do not write out the background, foreground, and NaN-color fields [Default will write them, i.e.
no_bg=False].log (bool) – For logarithmic interpolation scheme with input given as logarithms. Expects input z-values provided via
seriesto be log10(z), assigns colors, and writes out z.continuous (bool) – Force a continuous CPT when building from a list of colors and a list of z-values [Default is None, i.e. discrete values].
Select verbosity level [Default is w], which modulates the messages written to stderr. Choose among 7 levels of verbosity:
q - Quiet, not even fatal error messages are produced
e - Error messages only
w - Warnings [Default]
t - Timings (report runtimes for time-intensive algorithms)
i - Informational messages (same as
verbose=True)c - Compatibility warnings
d - Debugging messages
categorical (bool) – Do not interpolate the input color table but pick the output colors starting at the beginning of the color table, until colors for all intervals are assigned. This is particularly useful in combination with a categorical color table, like
cmap="categorical".cyclic (bool) – Produce a wrapped (cyclic) color table that endlessly repeats its range. Note that
cyclic=Truecannot be set together withcategorical=True.
Examples using pygmt.makecpt

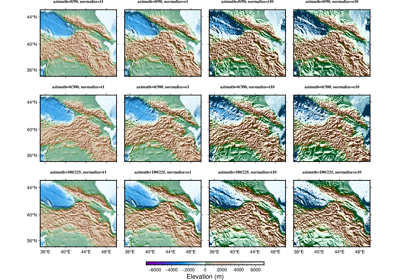
Calculating grid gradient with custom azimuth and normalize parameters


