Note
Go to the end to download the full example code.
Plotting lines
Plotting lines is handled by the pygmt.Figure.plot method.
import pygmt
Plot lines
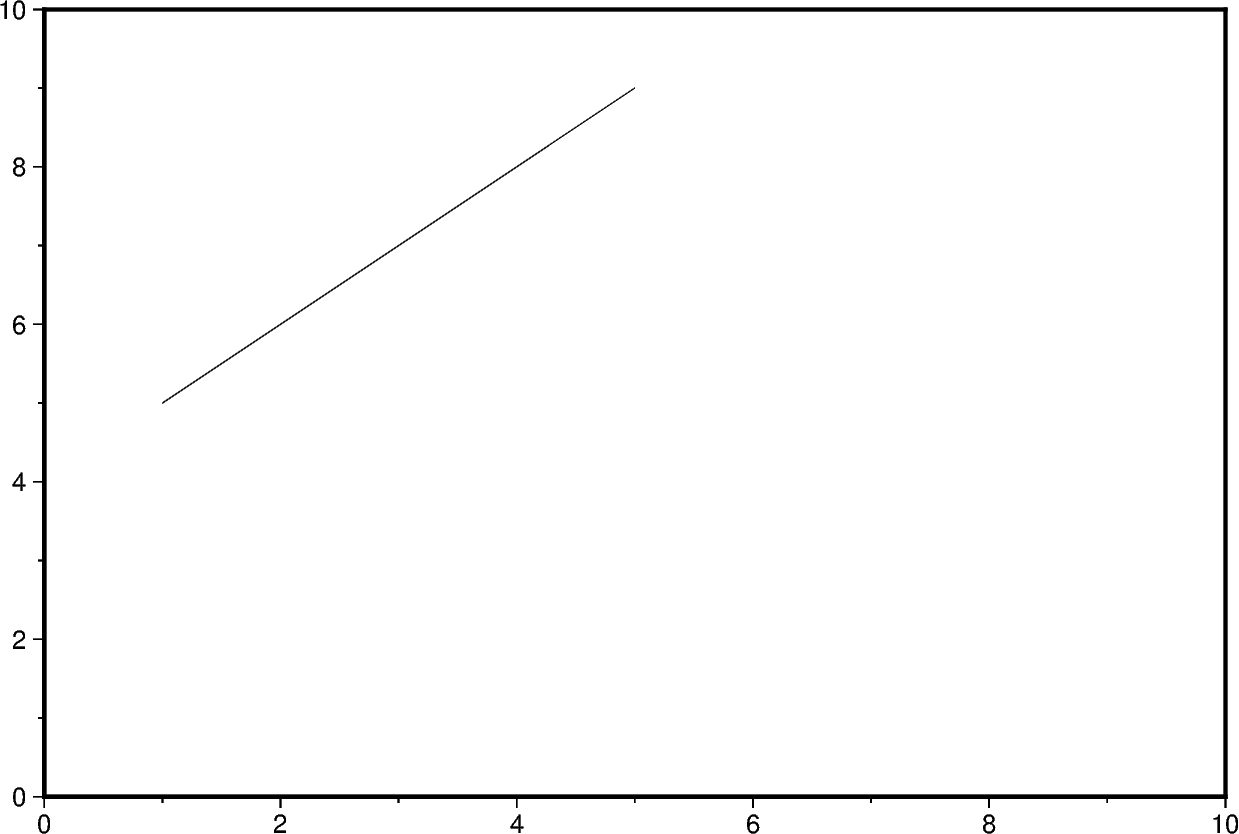
Create a Cartesian figure using the pygmt.Figure.basemap method. Pass lists
containing two values to the x and y parameters of the
pygmt.Figure.plot method. By default, a 0.25-points thick, black, solid
line is drawn between these two data points.
fig = pygmt.Figure()
fig.basemap(region=[0, 10, 0, 10], projection="X15c/10c", frame=True)

fig.plot(x=[1, 5], y=[5, 9])

fig.show()
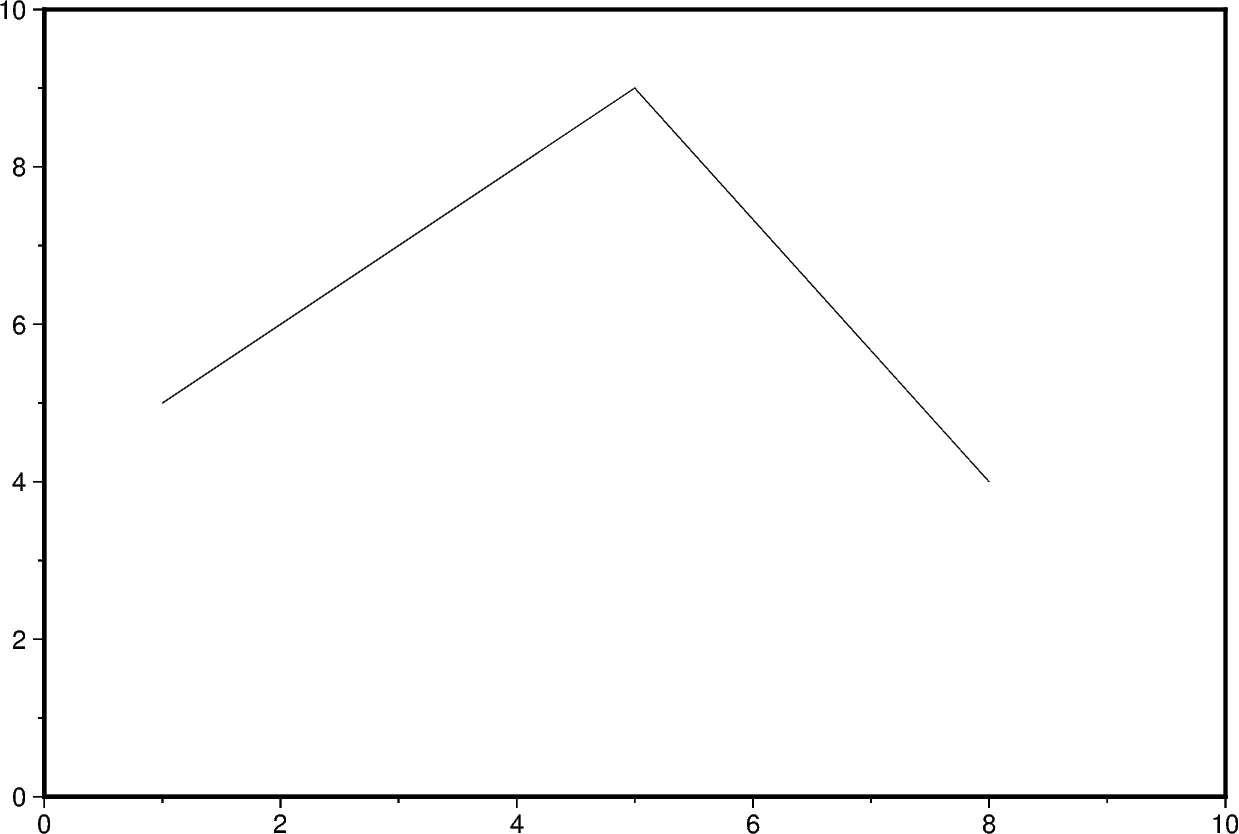
Additional line segments can be added by including more data points in the lists
passed to x and y.
fig = pygmt.Figure()
fig.basemap(region=[0, 10, 0, 10], projection="X15c/10c", frame=True)

fig.plot(x=[1, 5, 8], y=[5, 9, 4])

fig.show()
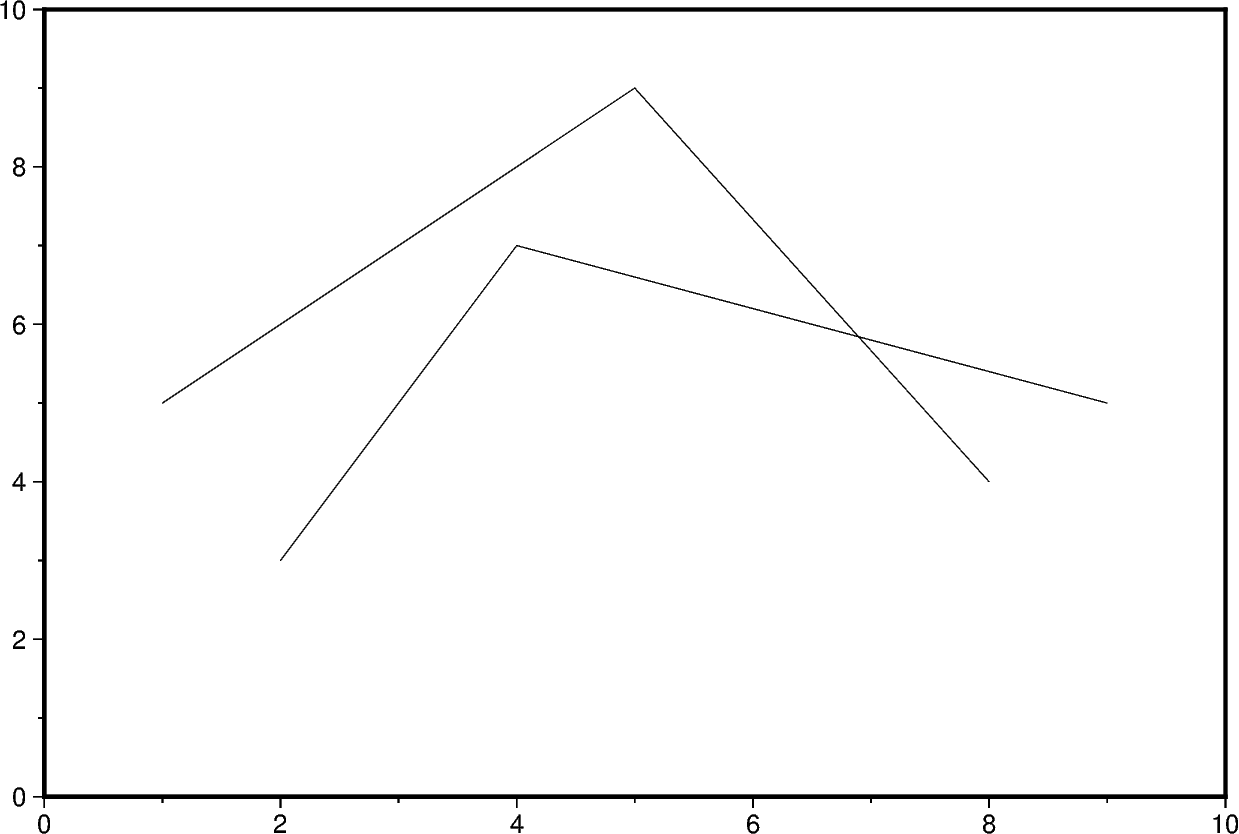
To plot multiple lines, pygmt.Figure.plot needs to be used for each line
separately.
fig = pygmt.Figure()
fig.basemap(region=[0, 10, 0, 10], projection="X15c/10c", frame=True)

fig.plot(x=[1, 5, 8], y=[5, 9, 4])
fig.plot(x=[2, 4, 9], y=[3, 7, 5])

fig.show()
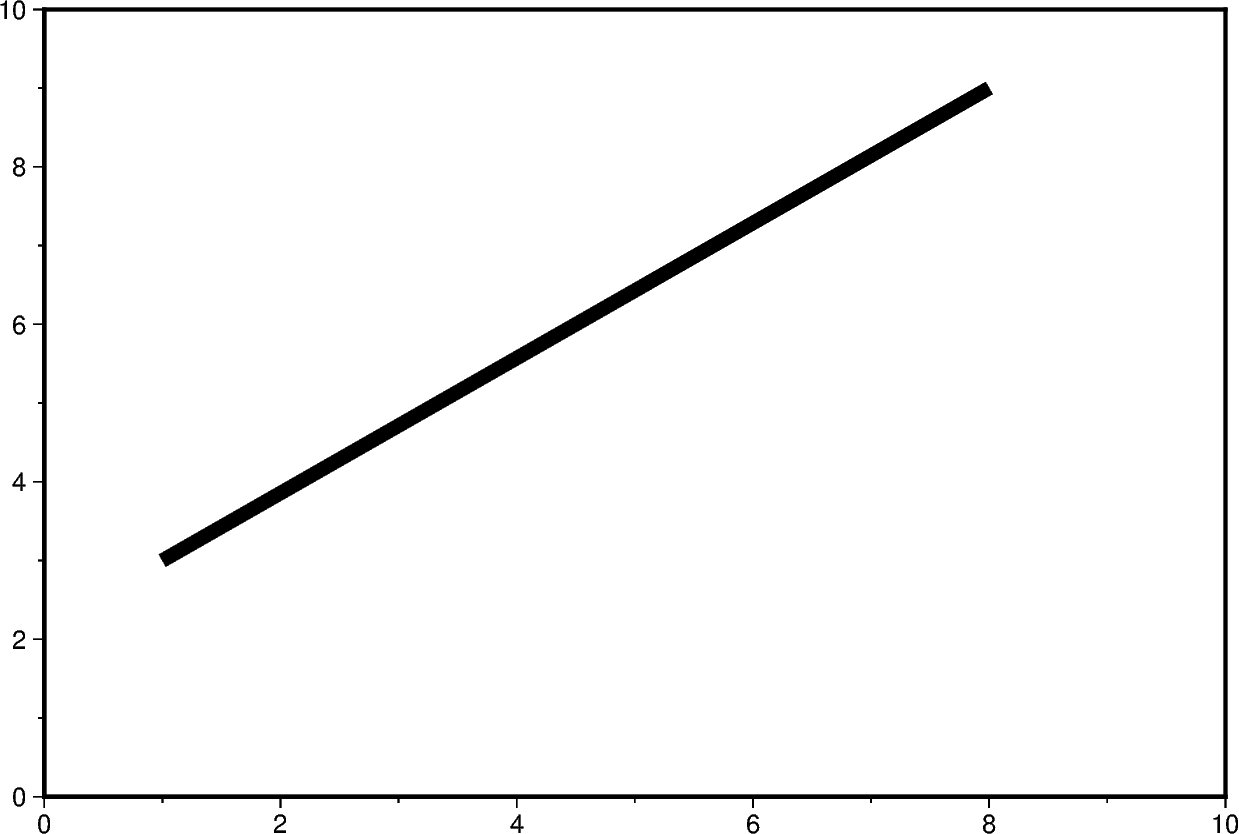
Change line attributes
The line attributes can be set by the pen parameter which takes a string
argument with the optional values width,color,style.
fig = pygmt.Figure()
fig.basemap(region=[0, 10, 0, 10], projection="X15c/10c", frame=True)

# Set the pen width to "5p" (5 points), and use the default color "black" and the
# default style "solid"
fig.plot(x=[1, 8], y=[3, 9], pen="5p")

fig.show()
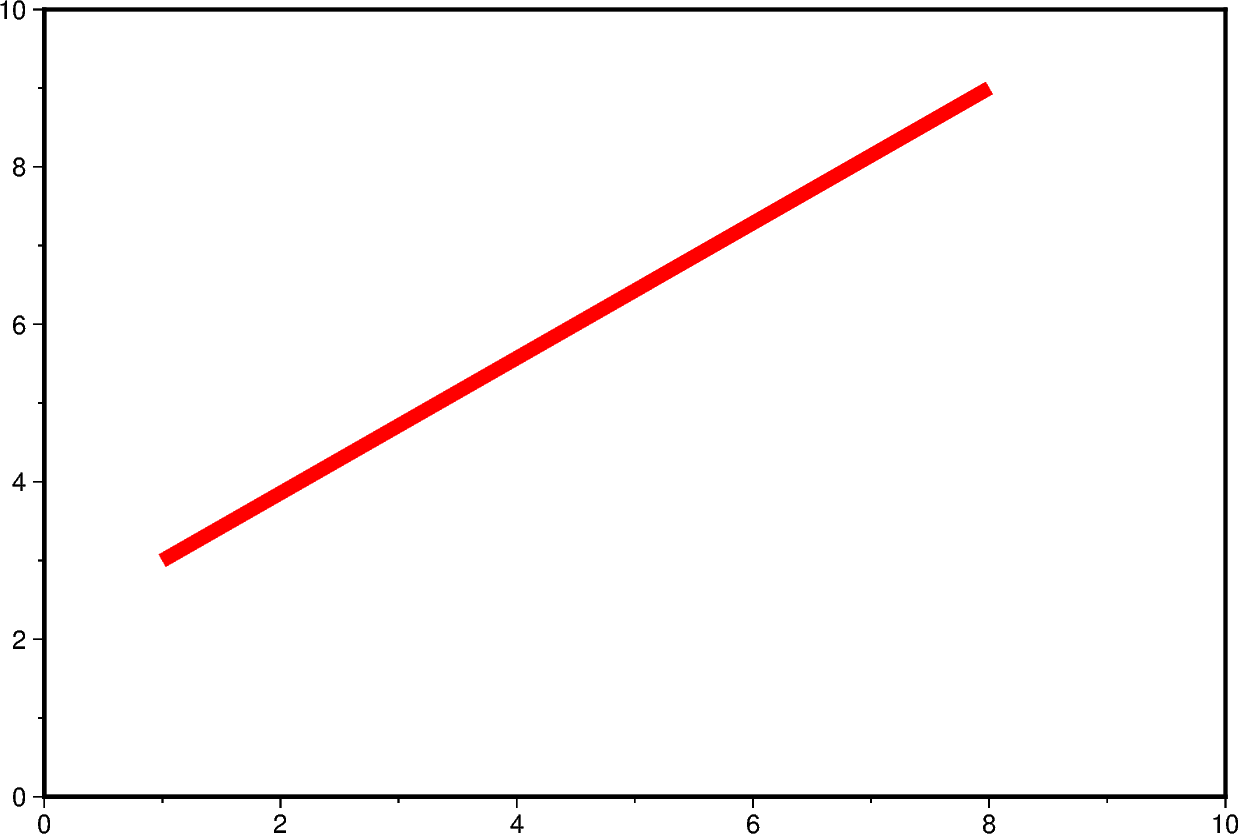
The line color can be set and is added after the line width to the pen
parameter.
fig = pygmt.Figure()
fig.basemap(region=[0, 10, 0, 10], projection="X15c/10c", frame=True)

# Set the line color to "red", use the default style "solid"
fig.plot(x=[1, 8], y=[3, 9], pen="5p,red")

fig.show()
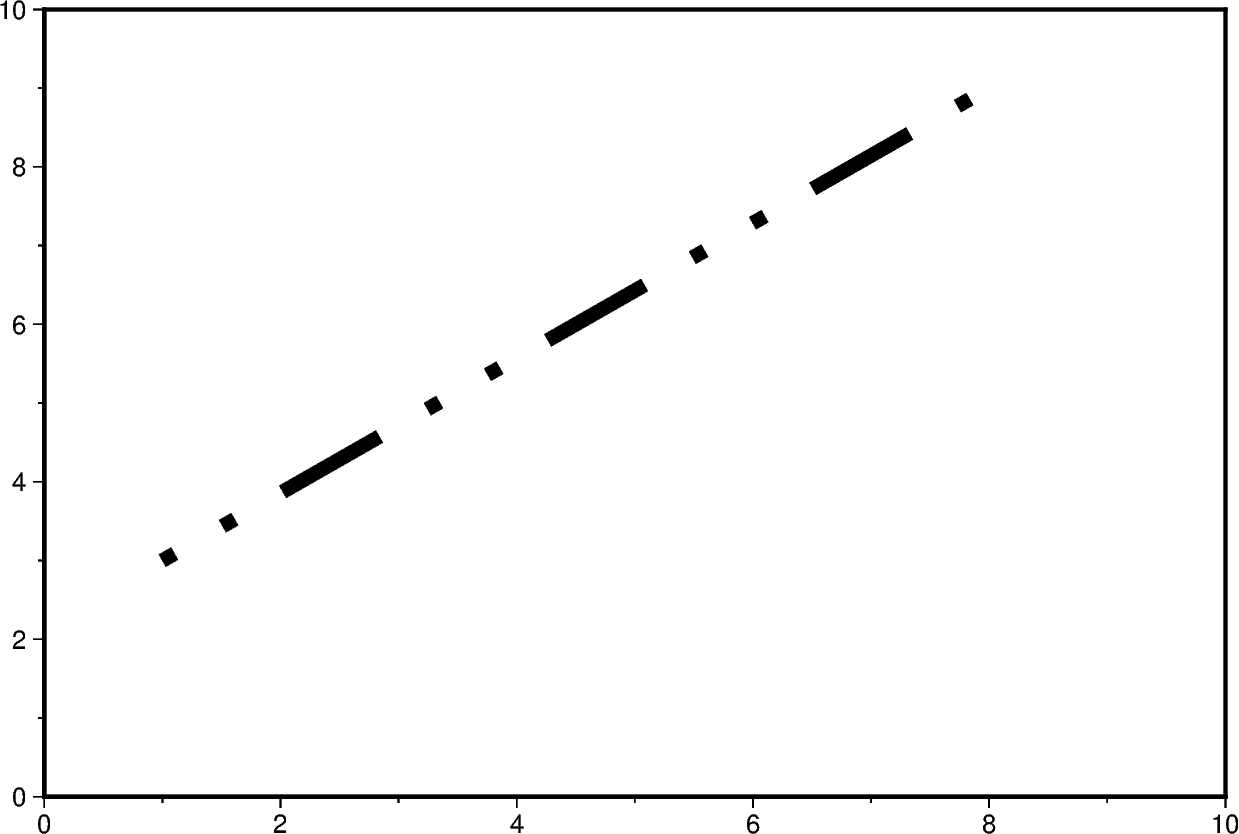
The line style can be set and is added after the line width or color to the
pen parameter.
fig = pygmt.Figure()
fig.basemap(region=[0, 10, 0, 10], projection="X15c/10c", frame=True)

# Set the line style to "..-" (dot dot dash), use the default color "black"
fig.plot(x=[1, 8], y=[3, 9], pen="5p,..-")

fig.show()
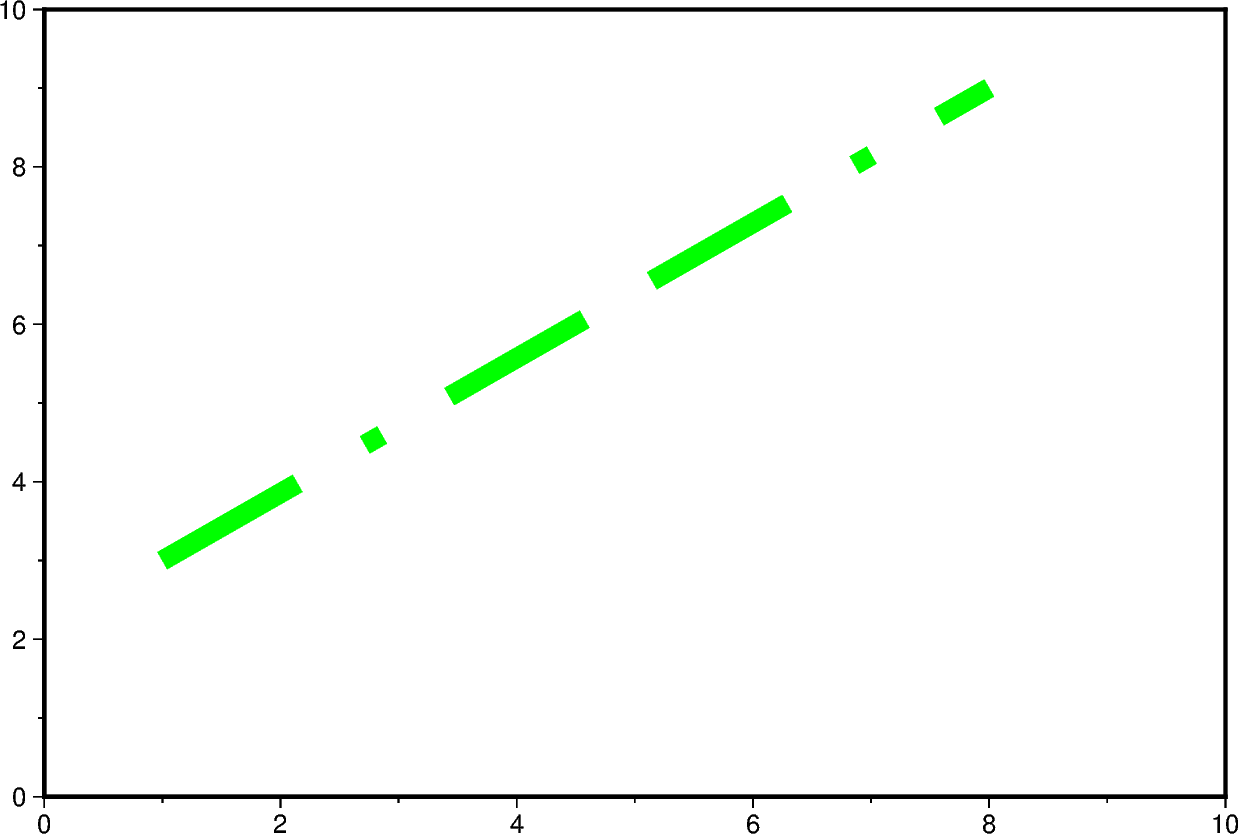
The line width, color, and style can all be set in the same pen parameter.
For a gallery example showing other pen settings, see
Line styles.
fig = pygmt.Figure()
fig.basemap(region=[0, 10, 0, 10], projection="X15c/10c", frame=True)

# Draw a 7-points thick, green line with style "-.-" (dash dot dash)
fig.plot(x=[1, 8], y=[3, 9], pen="7p,green,-.-")

fig.show()
Total running time of the script: (0 minutes 0.949 seconds)