Note
Go to the end to download the full example code.
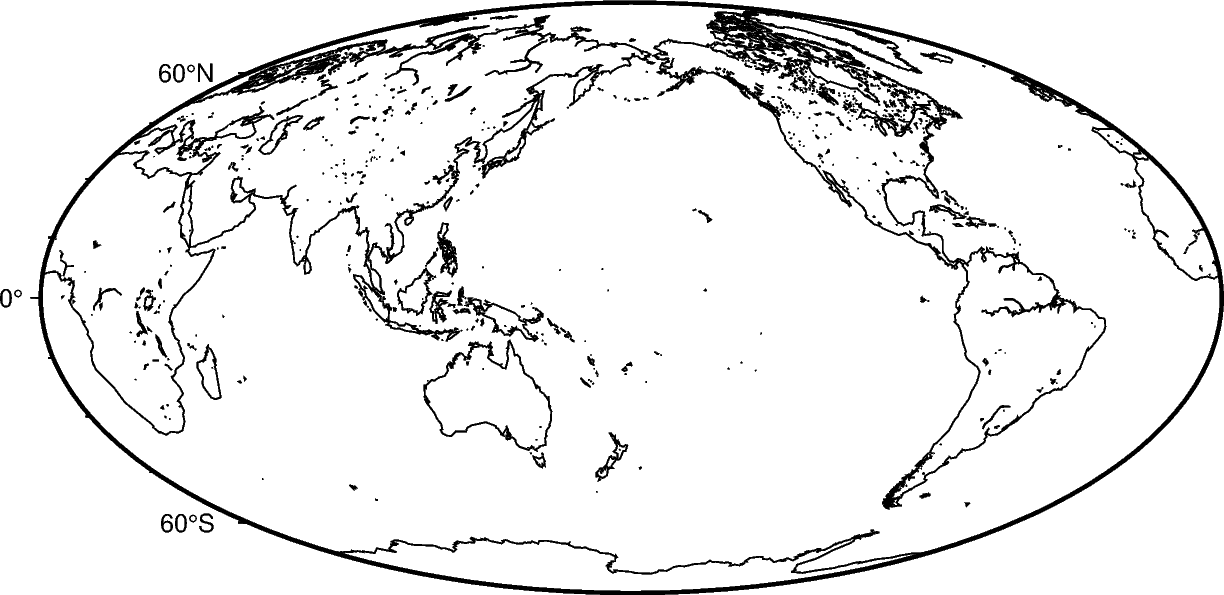
Shorelines
Use pygmt.Figure.coast to display shorelines as black lines.
import pygmt

fig = pygmt.Figure()
# Make a global Mollweide map with automatic ticks
fig.basemap(region="g", projection="W15c", frame=True)
# Display the shorelines as black lines with 0.5 point thickness
fig.coast(shorelines="0.5p,black")
fig.show()
Total running time of the script: (0 minutes 0.229 seconds)