pygmt.grdhisteq.equalize_grid
- static grdhisteq.equalize_grid(grid, outgrid=None, region=None, verbose=False, **kwargs)[source]
Perform histogram equalization for a grid.
pygmt.grdhisteq.equalize_gridprovides a way to write a grid with statistics based on a cumulative distribution function. Theoutgridhas relative highs and lows in the same (x,y) locations as thegrid, but the values are changed to reflect their place in the cumulative distribution.Full GMT docs at https://docs.generic-mapping-tools.org/6.6/grdhisteq.html.
Aliases:
C = divisions
N = gaussian
Q = quadratic
h = header
G = outgrid
R = region
V = verbose
- Parameters:
grid (
str|PathLike|DataArray) –Name of the input grid file or the grid loaded as a
xarray.DataArrayobject.For reading a specific grid file format or applying basic data operations, see https://docs.generic-mapping-tools.org/6.6/gmt.html#grd-inout-full for the available modifiers.
outgrid (
str|PathLike|None, default:None) – Name of the output netCDF grid file. If not specified, will return anxarray.DataArrayobject. For writing a specific grid file format or applying basic data operations to the output grid, see https://docs.generic-mapping-tools.org/6.6/gmt.html#grd-inout-full for the available modifiers.divisions (int) – Set the number of divisions of the data range.
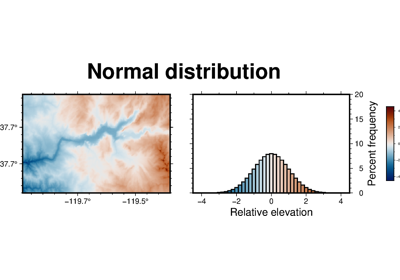
gaussian (bool or int or float) – norm. Produce an output grid with standard normal scores using
gaussian=Trueor force the scores to fall in the ±norm range.quadratic (bool) – Perform quadratic equalization [Default is linear].
region (str or list) – xmin/xmax/ymin/ymax[+r][+uunit]. Specify the region of interest.
verbose (bool or str) – Select verbosity level [Full usage].
- Return type:
- Returns:
ret – Return type depends on the
outgridparameter:xarray.DataArrayifoutgridisNoneNoneifoutgridis a str (grid output is stored inoutgrid)
Example
>>> import pygmt
>>> # Load a grid of @earth_relief_30m data, with a longitude range
>>> # of 10°E to 30°E, and a latitude range of 15°N to 25°N
>>> grid = pygmt.datasets.load_earth_relief(
...     resolution="30m", region=[10, 30, 15, 25]
... )
>>> # Create a new grid with a Gaussian data distribution
>>> grid = pygmt.grdhisteq.equalize_grid(grid=grid, gaussian=True)
See also
Note
This method does a weighted histogram equalization for geographic grids to account for node area varying with latitude.